class: left, top, title-slide # Introduction<br>Concepts ### Keith VanderLinden<br>Calvin University --- # Data Science *Data Science* is the *science* of extracting meaningful *information* from *data*. 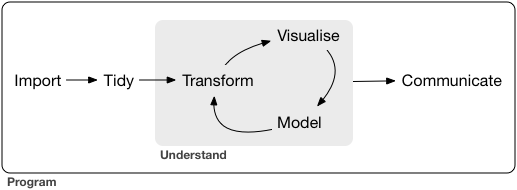 This course focuses on *data wrangling*, the process of preparing data for *analysis* and *visualization*. Our focus will be rather more on the *variety* of data than on the *volume* or *velocity* of that data. .footnote[Image from: https://r4ds.had.co.nz/introduction.html] ??? - Note: - the importance of "scientific method" - the distinction between data & information (cf. [DIKW](https://en.wikipedia.org/wiki/DIKW_pyramid)) - Walk through the diagram. - *Import* - File types (csv, rdb, text, image, audio, geosp). - Raw data will often need to be "cleansed". - *Tidy* - Data always needs to be "structured" appropriately. - *Transform* - We often focus in on data of interest and/or compute new, useful data items. - *Visualize* - Data is often displayed graphical, which invokes the (powerful) human visual system. - *Model* - We answer interesting questions by building predictive models. - *Communicate* - Conclusions must be presented to a broader audience. - In this class we focus on "Wrangling" = Importing + Tidying + Transforming --- # Data Science Skillset & Mindset Data science requires: - Skills & Knowledge - Statistics - Computation - Domain Expertise - Virtues - Humility - Integrity - Hospitality - Justice ??? - Skills & Knowledge - Statistics help establish *validity* and allow *prediction*. - Computation helps automate *reproducible* analyses of *big data*. - Domain expertise provides the *context* of the data and conclusions. - Virtues - Curiosity (see EDA below) - Moral Virtues - Humility (acknowledge sources, limits, [biases](https://en.wikipedia.org/wiki/List_of_cognitive_biases)) - Integrity (fight tendency to slant results our way) - Hospitality (present results clearly) - Justice (guard against potential harm) References: - Ken's DS skillset & concepts diagrams (https://cs.calvin.edu/courses/data/202/fa20/slides/w01/d1-welcome.html#5) - Ken's dispositions slides (12-16) (https://cs.calvin.edu/courses/data/202/21fa/slides/w01/w01d1-welcome.html#12) --- # Exploratory Data Analysis EDA is the process by which a data scientist explores a dataset in a systematic ways looking for patterns. The process is iterative, focused on the data, and generally involves: 1. Asking questions about your data. 2. Searching for answers using visualization, transformation, and modelling of your data. 3. Using what you learn to refine your questions and/or generate new questions. H. Wickam argues that data analysis is not so much of a process as it is a mindset. .footnote[See: https://rstudio.cloud/learn/primers/3.1] ??? One additional virtue: *curiosity* This is how the scientific method plays out in DS. It's the "understand loop" in the DS diagram on slide 1. References: - https://rstudio.cloud/learn/primers/3.1 & https://r4ds.had.co.nz/exploratory-data-analysis.html - https://en.wikipedia.org/wiki/Exploratory_data_analysis - R4DS 7: EDA uses "visualisation and transformation to explore your data in a systematic way". - MDSR 10: EDA identifies "patterns and multivariate relationships in data". - IDS 2: EDA analyses "analysing data sets to summarize its main characteristics". https://ids-s1-20.github.io/slides/week-02/w2-d02-data-viz/w2-d02-data-viz.html#8 - ModernDive 5: "EDA gives you a sense of the distributions of the individual variables in your data, whether any potential relationships exist between variables, whether there are outliers and/or missing values, and (most importantly) how to build your model."