HPC MPI Exercise 1: Homework Project
The Circuit Satisfiability Problem for a given binary circuit
is to find the set of inputs that cause that circuit to produce '1'
as its output.
For example, here is a 32-bit circuit diagram:
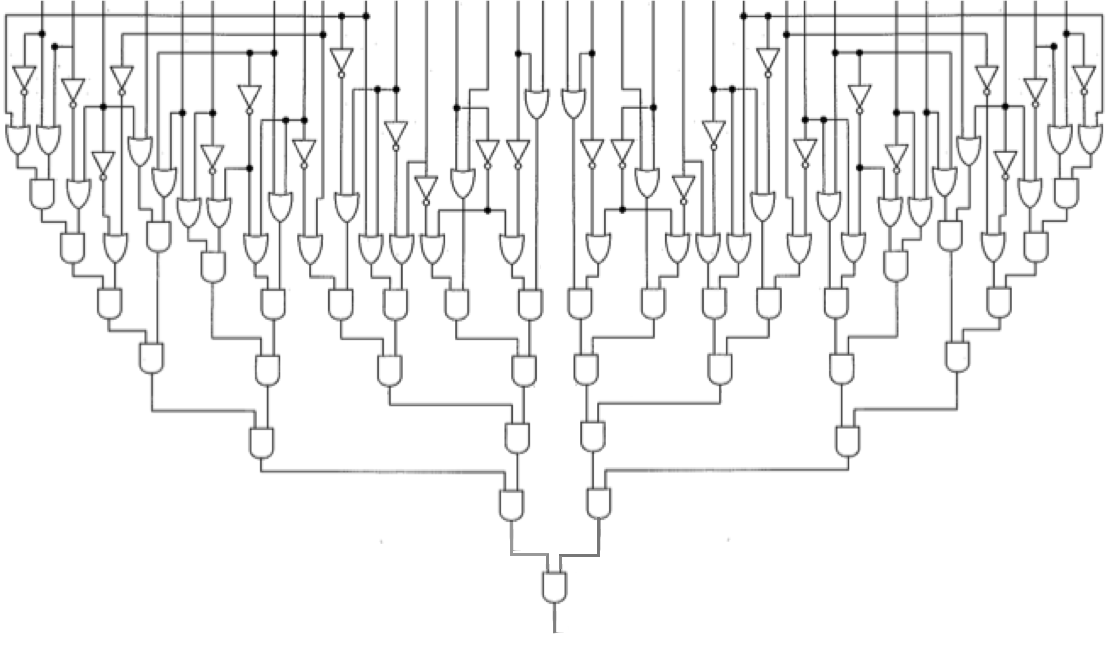
Since the circuit contains AND-gates, OR-gates, and inverters,
we can model that circuit in C using the boolean
AND (&&), OR (||), and NOT (!) operators.
The sequential program
circuitSatisfiability.c.
does this, and solves the problem by using a for loop to iterate
through all possible inputs, outputting those inputs that produce '1'.
Homework
Our research question for this project is:
Which of the two versions of the Parallel Loop pattern
produce the best performance for the Circuit Satisfiability Problem?
Or does it not matter?
To answer this question, our project has multiple parts:
-
In the Lab:
-
Download the program
circuitSatisfiability.c.
Using a text editor,
modify circuitSatisfiability.c.
so that it uses the MPI_Wtime() function
to time the computation:
     ...
     MPI_Init(&argc, &argv);
     double startTime = 0.0, totalTime = 0.0;
     startTime = MPI_Wtime();

     for (i = 0; i <= UINT_MAX; ++i) {
        count += checkCircuit(id, i);
     }

     totalTime = MPI_Wtime() - startTime;
     MPI_Finalize();

     printf("Process %d finished in time %f secs.\n", id, totalTime);
     ...
(Note that you will have to #include <mpi.h>
in order for the program to compile.)
Then compile the program as follows:
mpicc circuitSatisfiability.c -Wall -ansi -pedantic -std=c99 -o circuitSatisfiability
When your program compiles without errors, run it as follows:
./circuitSatisfiability
With these modifications, the program will self-report how long it
takes to check the circuit.
Warning: This program must run the circuit using 232 inputs;
on my machine, it took ~7 minutes to finish.
I recommend bringing some other work to do while it runs!
-
Create a spreadsheet (e.g., use Excel or a Google Sheet)
with the column headings Number of Processes and Time.
In the first row beneath these headings, enter '1' and the
time (in seconds) reported by your program.
This will serve as our baseline time against which we'll compare
subsequent times.
In an adjacent cell of the spreadsheet, record how many solutions
this sequential version of the program found.
-
Make a copy of circuitSatisfiability.c, naming the copy
circuitSatisfiabilitySlices.c.
Using any text editor, update its header comment so that it explains
"the 5 Ws":
who (your name),
what (the file's name and what its code does differently),
where (Calvin University),
when (the date), and
why (for CS 374, project 1).
Style and documentation are a significant portion of your project grade,
so get in the habit of doing this for each file that you create/edit.
See the documentation of circuitSatisfiability.c for a model.
-
Using parallelLoopSlices.c as a model,
use the 'Slices' version of the Parallel Loop pattern to
improve the performance of circuitSatisfiabilitySlices.c.
-
Use MPI's version of the Reduction
pattern to sum the distributed processes' count-values into a
global count.
(Make certain this global count matches the count-value
of the sequential version.)
-
With the exception of the outputs produced by processes as they
discover inputs that cause the circuit to output '1',
use the Master-Only pattern to perform all other output,
including the initial feedback message at the beginning,
and the global count and time at the end.
Make certain that your timing does not include those preliminary and
final output operations,
since they should be the same for any two executions.
-
Make a copy of circuitSatisfiabilitySlices.c, naming the copy
circuitSatisfiabilityChunks.c, and update its header comment
as necessary.
Using parallelLoopChunks.c as a model,
use the 'Chunks' version of the Parallel Loop pattern to
improve the performance of circuitSatisfiabilityChunks.c.
-
When both programs compile correctly and produce the correct results,
time their executions with 2, 4, 8, 16, 32, 64, 128, and 256 processes.
For each program,
enter these numbers and the corresponding times in your spreadsheet.
In the lab, you are competing for cores with other students,
so depending on how many lab machines are booted into Linux
(i.e., how many machines are in your hosts file),
it is possible that you may exhaust the number of available cores,
in which case mpirun will generate an error.
If this happens, you can invoke mpirun with
the -oversubscribe switch, which tells it to launch more
processes on a machine than its number of cores.
See
the mpirun manual page for more details and other options.
-
To compare the performances of your slices and chunks versions in the lab,
create a line-chart of your spreadsheet's values,
with the number of processes on the X-axis and
time on the Y-axis.
Give this chart a title that clearly indicates what it measures
and where the measurements were recorded (e.g., the CS Labs).
Label the scale of your X-axis with the number of processes
(1, 2, 4, 8, 16, 32, 64, 128, and 256)
so that this axis indicates the scale at which measurements were taken.
Since these X-axis values reflect exponential growth,
experiment with using a log-scale on your Y-axis to see if that
increases the separation between the two lines.
-
On the Cluster:
-
Transfer both of your source programs to the cluster
(borg.calvin.edu).
To do this conveniently, you will need to
set up key-based authentication
between your lab machine and the cluster.
Once you have these keys set up, you can use
the secure-copy program scp to transfer your file
from your project directory to a directory on the cluster.
For example, for the program in the file named
circuitSatisfiabilitySlices.c,
I can transfer it from my project directory in the lab
to my 374/proj01 directory on the cluster by entering:
scp circuitSatisfiabilitySlices.c adams@borg.calvin.edu:~/374/proj01
You can use a similar approach to transfer other files
(e.g., circuitSatisfiabilityChunks.c) to the cluster;
you can also reverse the order of the arguments to scp
to transfer files from the cluster back to your workstation in the lab.
-
Once you have transferred your programs to the cluster,
I recommend that you save and transfer a copy of this
Makefile to the cluster,
as that will simplify compiling your programs there.
-
Having transferred these files to the cluster,
use ssh to login there.
From Calvin's campus, I would enter:
ssh adams@borg.calvin.edu
-
Once you are logged into the cluster, you can cd to your
project directory, and then enter:
make
to compile both your programs there.
-
To run programs on the cluster,
we do not want your classmates' programs to interfere with
your programs' performances.
To prevent such interference,
everyone must use a batch queueing system
named SLURM to run programs on the cluster.
To run your program, follow these directions for
Using Slurm on Borg.
-
Using those directions,
repeat the timing experiments you did in the lab,
using 1, 2, 4, 8, 16, 32, 64, 128, and 256 processes.
The cluster has 20 compute-nodes, each with 16 cores,
but their clock speeds are different from those in the CS labs.
To get the best performance, tell SLURM to
use one node for your 1, 2, 4, 8 and 16 process runs;
then for each subsequent run, tell SLURM to use 16 processes
and double the number of nodes being used.
-
Record your timing data in your spreadsheet
and add a second line-chart to your spreadsheet,
comparing your two programs' times on the cluster.
Note that our entire class can work "at the same time" on the cluster.
The Slurm batch system uses a queue to schedule the submitted jobs,
and only runs a job when all of the resources it requires are available;
this will prevent anyone's jobs from interfering with anyone else's jobs.
You can even submit multiple jobs at the same time
and they will not interfere with one another
-- they will just be queued up and scheduled as the resources they require
become available.
However, if you and lots of people wait until the night
before the project is due to collect your timing data,
you may experience much longer wait-times, since the queue will be
that much longer...
-
Finally:
Write a 1-page analysis of this project,
in which you answer the research question
and interpret the data you have collected about your programs.
Explain what your charts reveal about your programs' performances:
how their performances change as the number of processes changes,
how your two programs' performances compare to one another,
how running them in the lab compares to running them on the cluster, etc.
Make your analysis as quantitative as you can;
wherever possible you should support your claims by
citing specific points from your charts and/or
values from the data you collected.
You should also report any surprising discoveries or other observations
you've made during the course of this exercise.
If you used an AI tool for any part of the project,
add a second page to your analysis in which you name the specific tool
you used, describe the tasks for which you used it,
list the prompts you used, indicate what worked and what did not,
what you did to verify the correctness of the AI's outputs,
and so on.
See
the
course policies for more information.
Hand In
Hard copies of:
-
Your written analysis of this project.
Print this using the print function of
the word processor you use to write your analysis.
-
Your line charts and spreadsheet data.
The spreadsheet data can be printed using your spreadsheet application,
but each line chart should be printed on a separate page
and maximally sized to fill that page
so that the chart reveals as much detail as possible.
(If necessary, copy each chart into a word processing application
and print it from there.)
Be sure each chart has a descriptive title to indicate how it is different,
and clearly label your axes (including units).
Provide a legend beneath your chart's title and
use different kinds of lines (e.g., solid vs. dashed) on your charts
to clearly indicate which program each line represents,
so that your lines can be clearly distinguished
when printed in black-and-white or gray scale.
As noted previously, if the two lines are very close to one another,
experiment with using a log-scale on the Y-axis
to maximize the separation between the two lines.
-
A text file created in the lab by the program script,
in which for each program, you:
- Use cat to list its source file(s),
- Use make to show that it compiles without errors or warnings, and
- Use mpirun to show that it runs correctly in the lab
using 16 processes.
When you are done, use Ctrl-d to exit the script program.
To save paper, use the enscript command to print
the file created by script.
For example, if your script file is named
typescript, you can enter:
enscript typescript
and your typescript file will be printed in two-up format,
using both sides of the sheet of paper on printers that support
2-sided printing.
-
Two of the .out output files generated by Slurm on the cluster
using 32 processes--one for each version of your program.
Use scp to transfer these files from the cluster
back to your lab workstation.
From there, you should be able to print both files (two-up, front-and-back)
by entering:
cat *.out | enscript
and then printing on a printer that supports 2-sided printing.
Please staple all of these pages together
and make certain that your name is on each page,
in case the pages become separated.
CS >
374 >
Exercises >
01 >
Homework Project
This page maintained by
Joel Adams.