Loading and Plotting Data
Takeaways of the week
- Libraries like
numpyandmatplotlibprovide pre-packaged useful functionality - Using them builds on fundamental concepts you learned earlier (data types, Boolean expressions, etc.)
- Files are just named strings; they need to be interpreted (including data types)
This week
Fundamentals of the Python scientific computing ecosystem
numpymatplotlib
Fundamentals of data storage
- CSV files
Array Programming: numpy
aka np, because it’s canonically imported as:
numpy
- Numerical computing library for Python
- Provides the
arraydata type. Like alistbut:- Automatic
forloops! - Supports multiple dimensions
- Automatic
- …and lots of utilities
arange:rangethat makesarrayszeros/ones/full: make new arrays- lots of math functions
example
Arrays have consistent data types
All ints:
All floats:
np.arange
Like range, but:
- makes NumPy
arrays - allows
floats
Broadcasting (automatic for loops!)
array plus scalar:
array plus array:
Applying a function to every element:
Reduction operations
Reduce the dimensionsionality of an array (e.g., summing over an axis)
Example: computing error
Suppose we’re fitting a model to some data. The true values are:
And the model predicts:
MAE: mean absolute error: average of absolute differences
\[ \text{MAE} = \frac{1}{n} \sum_{i=1}^n |y_i - \hat{y}_i| \]
MSE: mean squared error or RMSE: root mean squared error
\[ \text{MSE} = \frac{1}{n} \sum_{i=1}^n (y_i - \hat{y}_i)^2 \]
Can you write NumPy code to compute these? (You’ll need np.abs not abs for arrays.)
matplotlib
Import:
Example
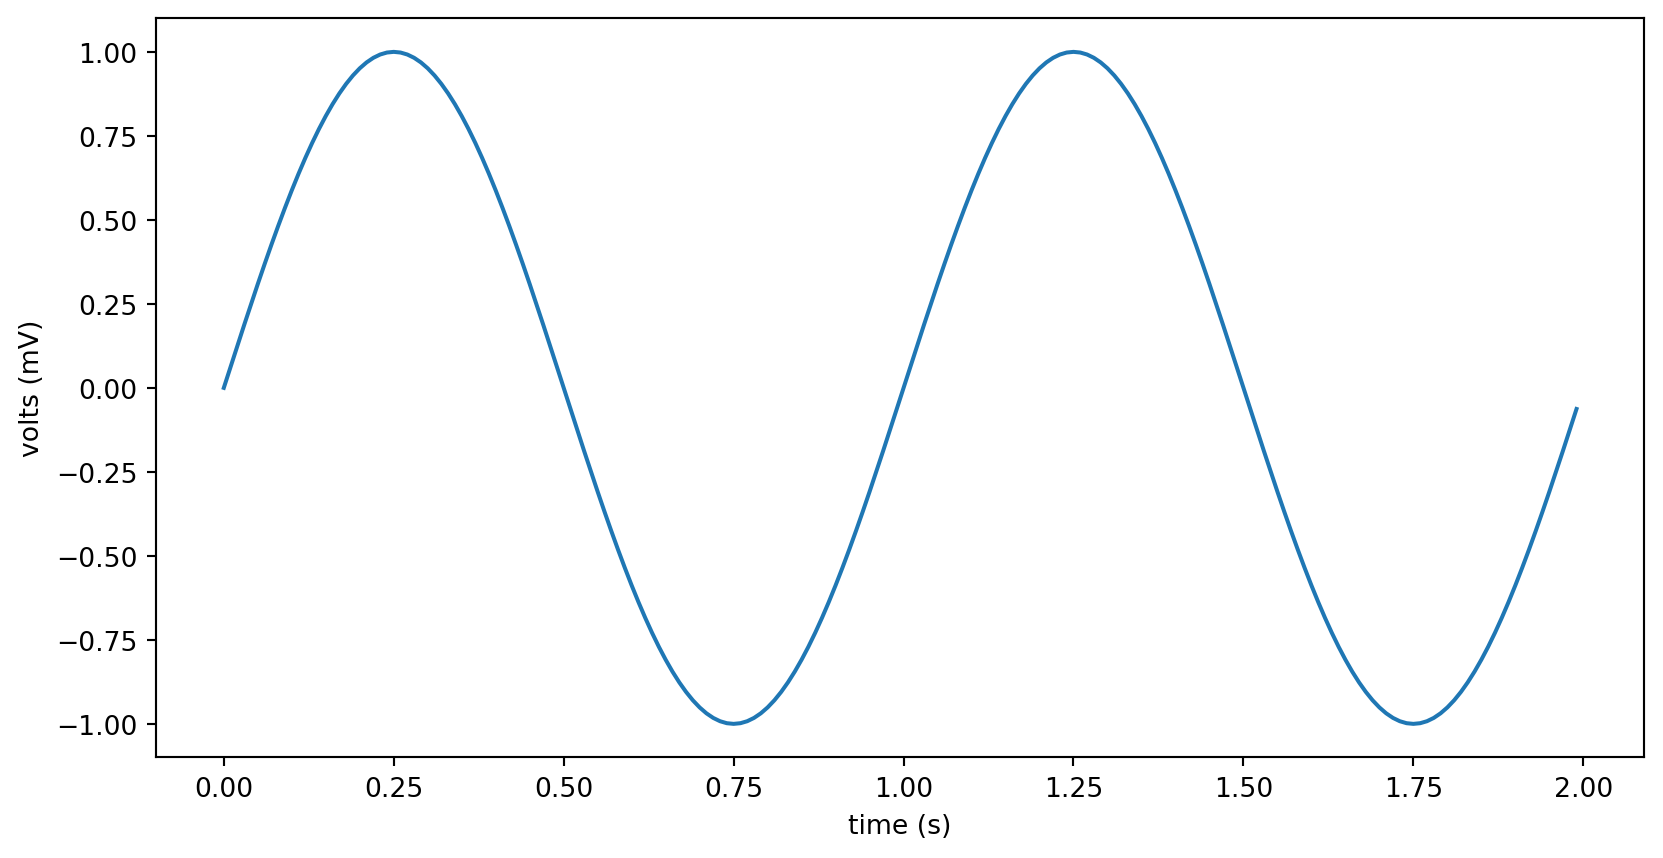
What type of thing is y?
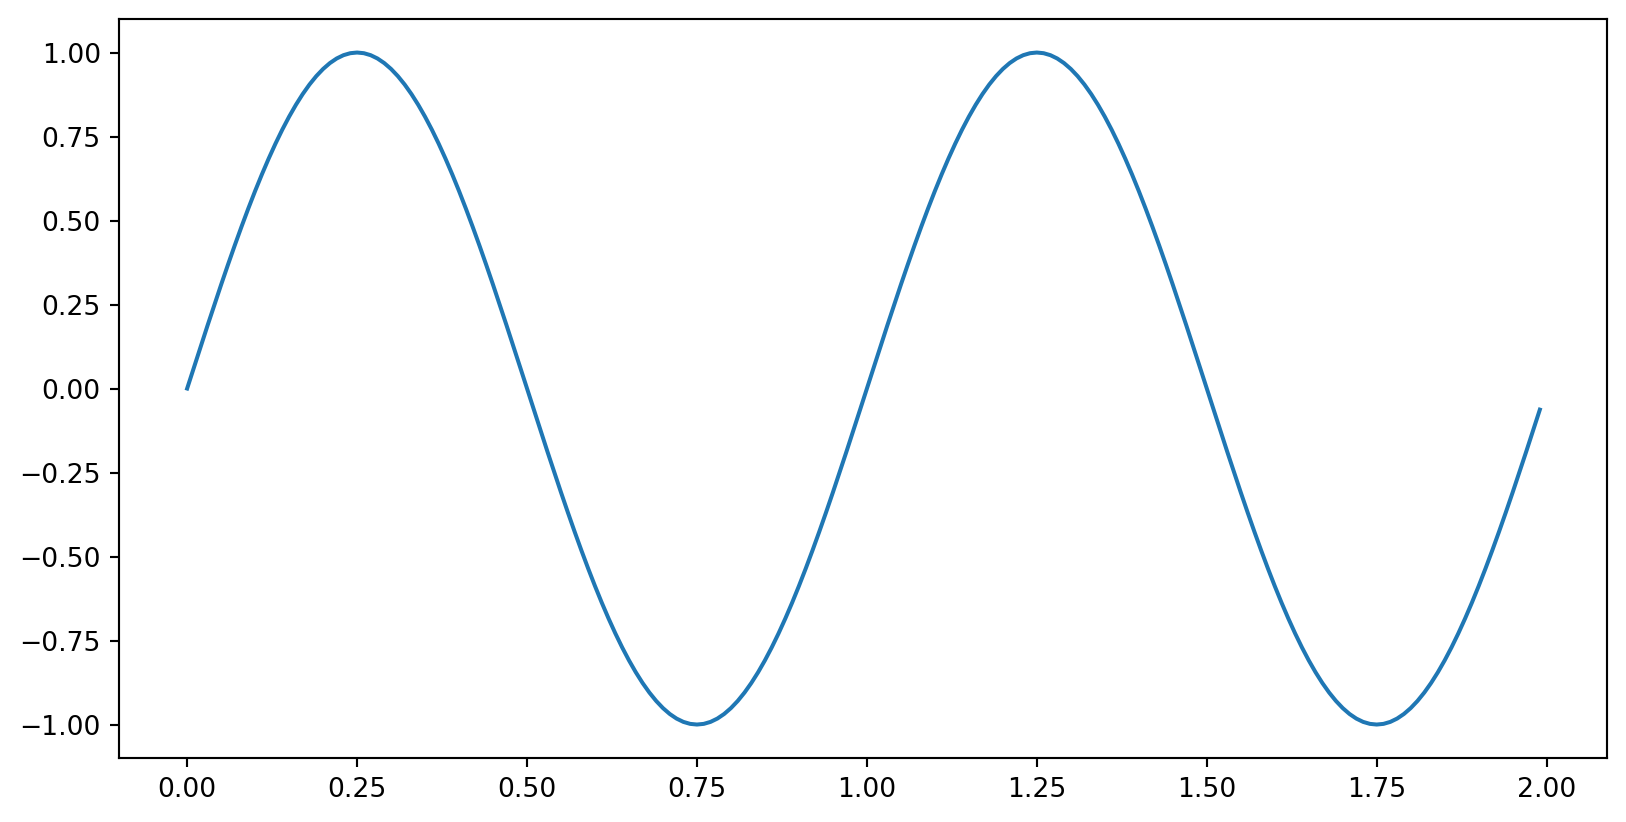
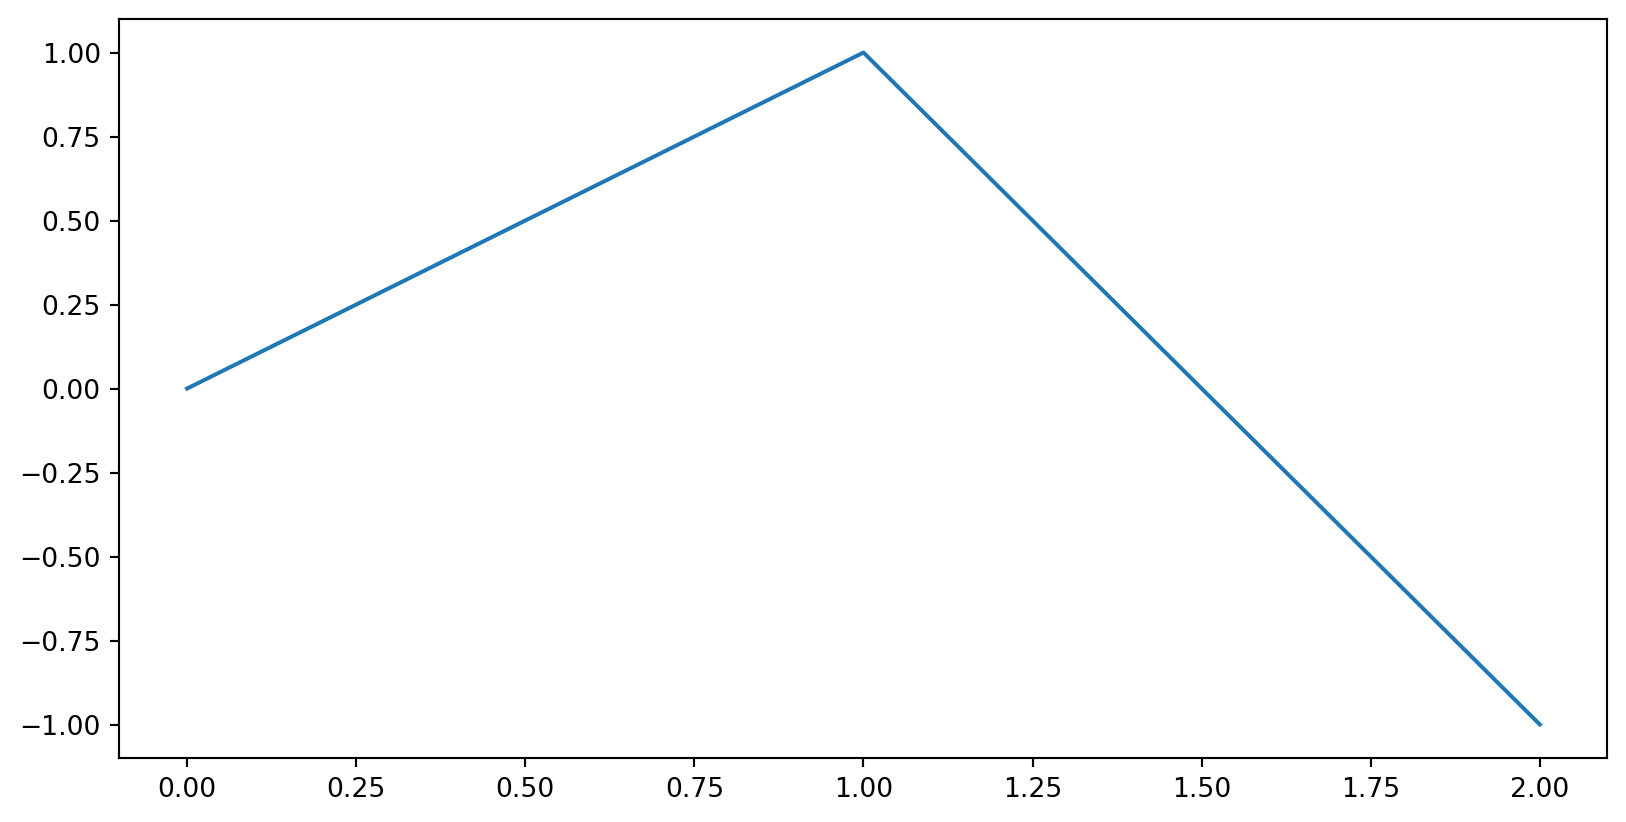
Variations
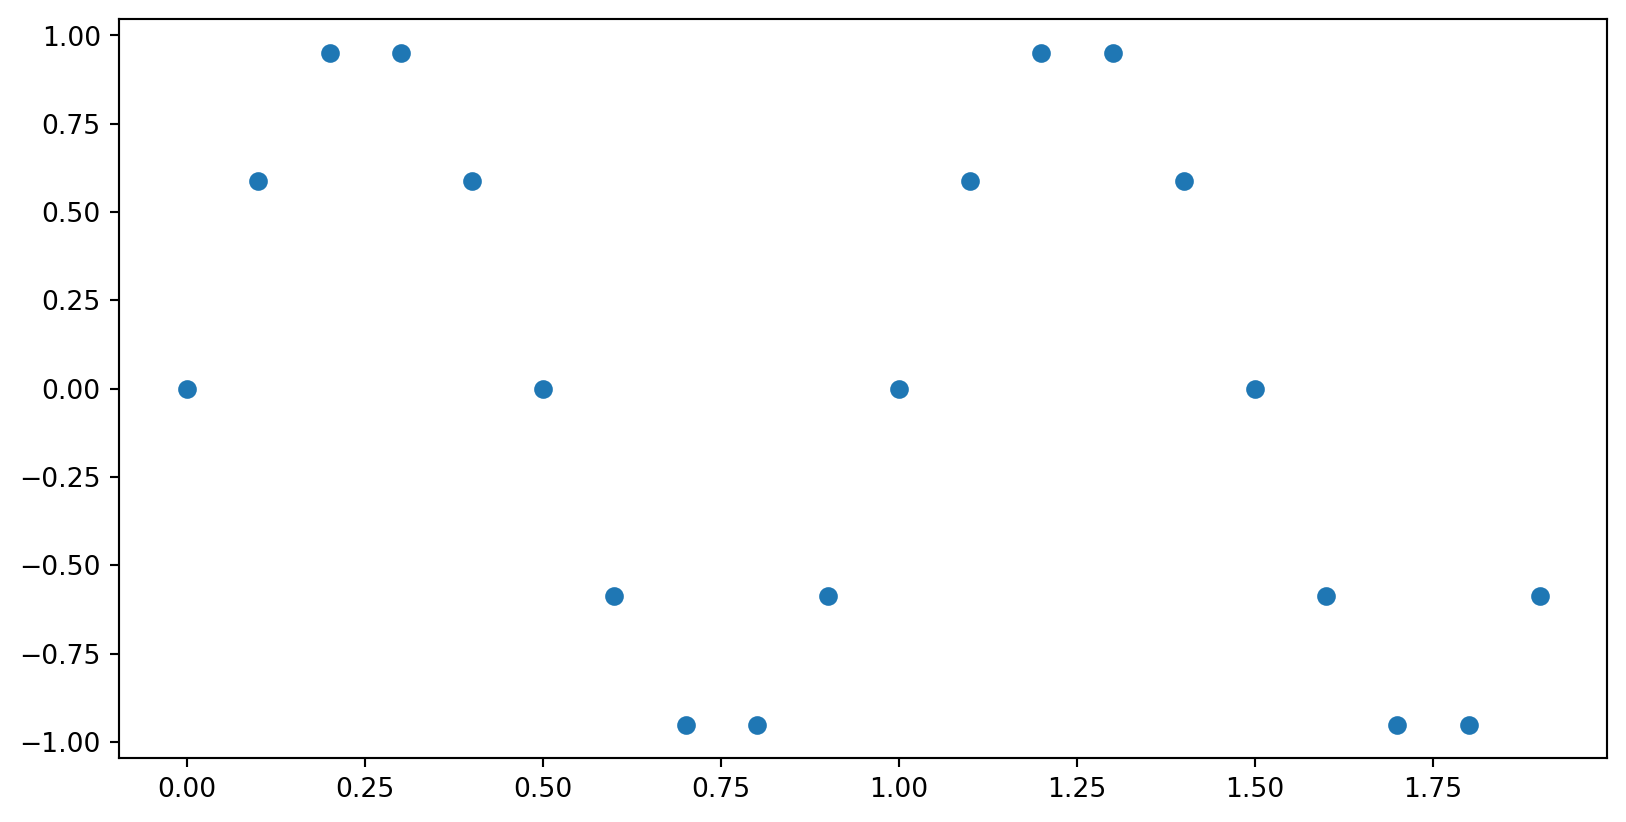
Write code that makes this plot.
Matplotlib Recipe
- Import…
import matplotlib.pyplot as plt- Optionally,
import numpy as np
- Make list(s) of data (all the same length)
- Call
plt.plot()to construct plot- or
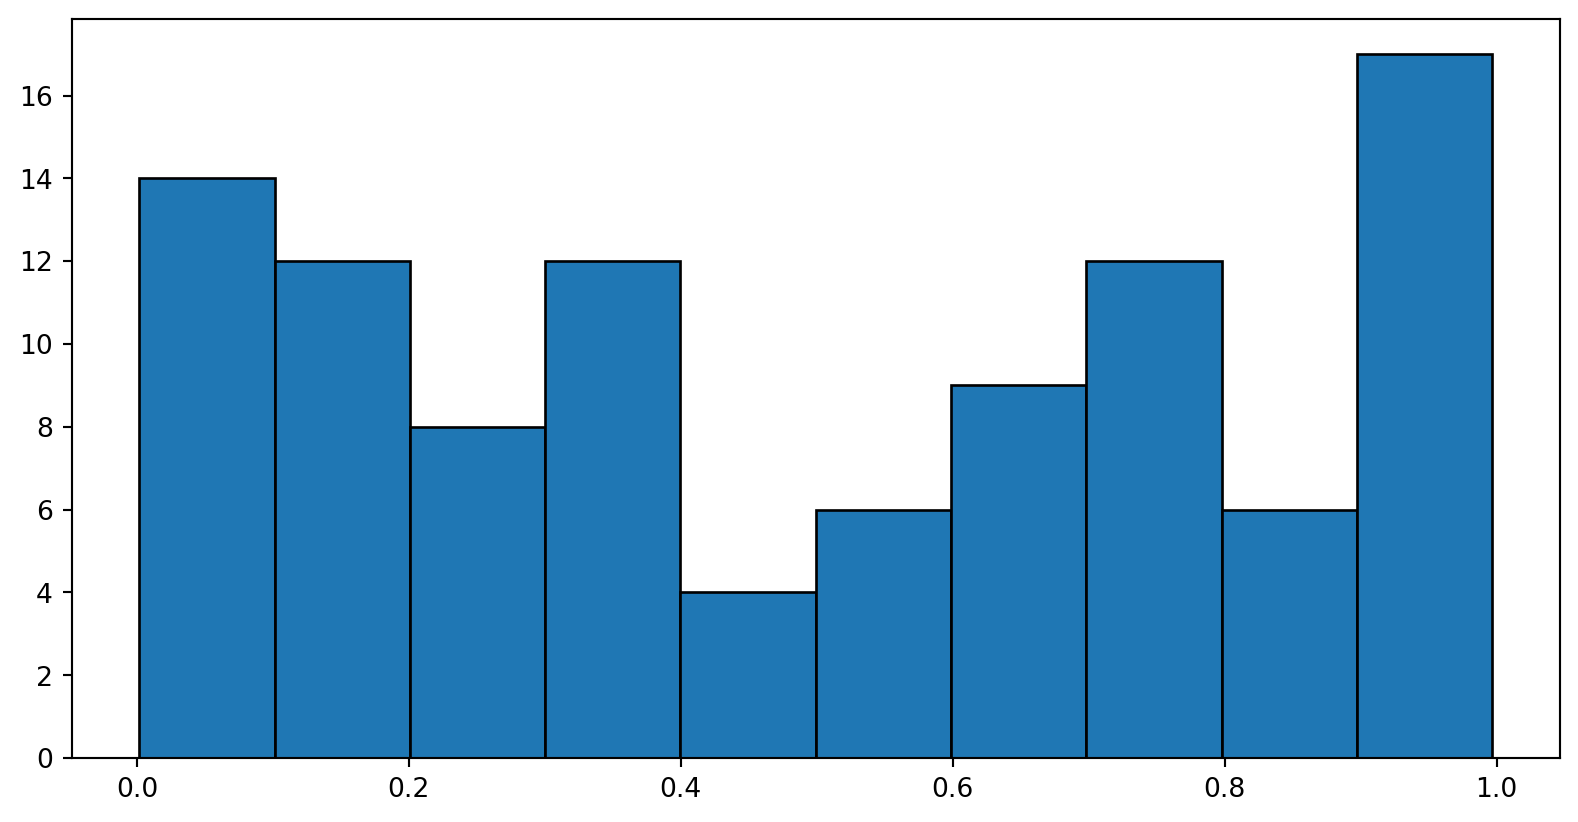
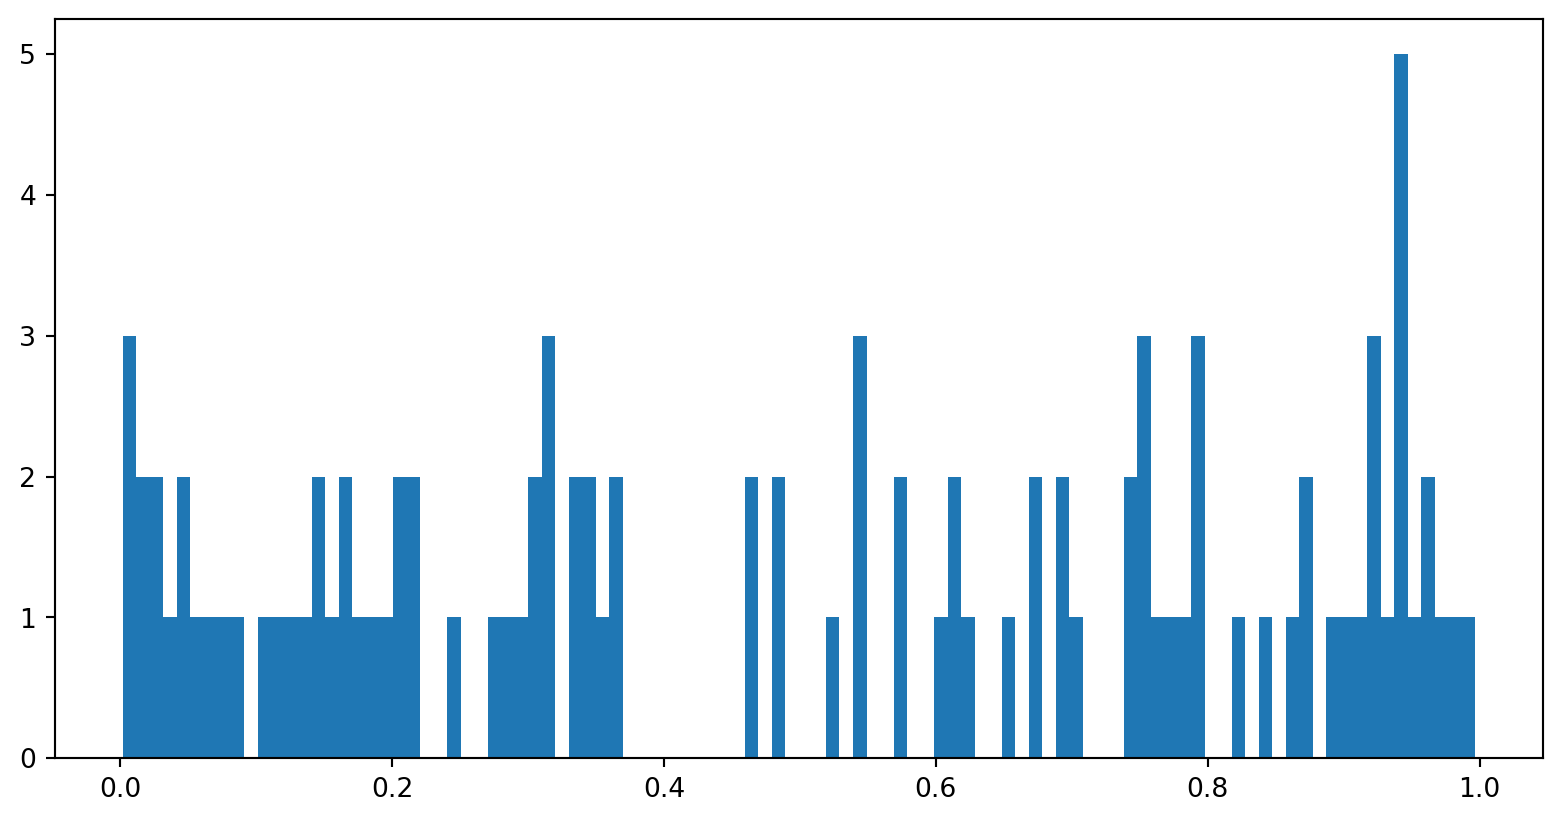
plt.hist(),plt.scatter(),plt.bar(), …
- or
- Add labels, legends, etc.
plt.savefig('filename.png')plt.show()
What will this plot?
- a parabola
- a diagonal line
- syntax error
- label error
matplotlib details
- Data doesn’t have to be
numpyarrays, but it’s often handy. - Many different plot types!
plt.histogram
Files
Files
- full path (
/Users/me/Documents/Research/experiment1.csv). includes:- name (make it meaningful, not
untitled5023.py) - extension: indicates its type (e.g.,
.csv,.py,.docx) - path: where to find it
- name (make it meaningful, not
- contents: sequence of bytes (basically a
string)
Aside: organize your files!
- Meaningful folders (by project, by class)
- Backed up! (easiest: use OneDrive or similar)
Reading Files: all at once
File not found?
- URL: world-wide unambiguous name for a file (but on a website, often needs to be downloaded)
- Full path: unambiguous name for a file — on a specific computer!
- Relative path: depends on working folder (aka current directory)
"data.csv"actually meansos.getcwd() + "/" + "data.csv"- Thonny sets working folder to the folder containing the
.pyfile
- So either:
- Use a full path to the file
- or (preferred): put the file you need right next to your script
- … or in a
datafolder and usedata/data.csv
What results?
Reading Files
The content of a file is just a string. (maybe really long)
'Name,Location,URL,Students\nWestminster College,"Sa'We can split it into lines:
Name,Location,URL,Students
Westminster College,"Salt Lake City, UT",westminstercollege.edu,2135
Muhlenberg College,"Allentown, PA",muhlenberg.edu,2330
University of Maine,"Orono, ME",umaine.edu,8677
James Madison University,"Harrisonburg, VA",jmu.edu,19019
Michigan State University,"East Lansing, MI",msu.edu,38853Reading Files: line by line
['Name', 'Location', 'URL', 'Students']
['Westminster College', '"Salt Lake City', ' UT"', 'westminstercollege.edu', '2135']
['Muhlenberg College', '"Allentown', ' PA"', 'muhlenberg.edu', '2330']
['University of Maine', '"Orono', ' ME"', 'umaine.edu', '8677']
['James Madison University', '"Harrisonburg', ' VA"', 'jmu.edu', '19019']
['Michigan State University', '"East Lansing', ' MI"', 'msu.edu', '38853']
What’s wrong?
Reading Files: CSV
['Name', 'Location', 'URL', 'Students']
['Westminster College', 'Salt Lake City, UT', 'westminstercollege.edu', '2135']
['Muhlenberg College', 'Allentown, PA', 'muhlenberg.edu', '2330']
['University of Maine', 'Orono, ME', 'umaine.edu', '8677']
['James Madison University', 'Harrisonburg, VA', 'jmu.edu', '19019']
['Michigan State University', 'East Lansing, MI', 'msu.edu', '38853']
CSV Column Names
Column names: ['Name', 'Location', 'URL', 'Students']
['Westminster College', 'Salt Lake City, UT', 'westminstercollege.edu', '2135']
['Muhlenberg College', 'Allentown, PA', 'muhlenberg.edu', '2330']
['University of Maine', 'Orono, ME', 'umaine.edu', '8677']
['James Madison University', 'Harrisonburg, VA', 'jmu.edu', '19019']
['Michigan State University', 'East Lansing, MI', 'msu.edu', '38853']
DictReader
open("data.csv")open(data.csv)
File names are strings.
Looping through CSV data
Converting Data Types
Files are always just strings. If we want ints, we need to convert:
Getting a whole column
Debug and add comments to the following code.
Easier way: pandas
| Name | Location | URL | Students | |
|---|---|---|---|---|
| 0 | Westminster College | Salt Lake City, UT | westminstercollege.edu | 2135 |
| 1 | Muhlenberg College | Allentown, PA | muhlenberg.edu | 2330 |
| 2 | University of Maine | Orono, ME | umaine.edu | 8677 |
| 3 | James Madison University | Harrisonburg, VA | jmu.edu | 19019 |
| 4 | Michigan State University | East Lansing, MI | msu.edu | 38853 |
We’ll study this next week.