Start by setting a breakpoint at a suitable place in your program. Do this by clicking mouse-right on the gray bar to the left of your code in the editing window and choosing “Toggle Breakpoint”. The result will look something like this:
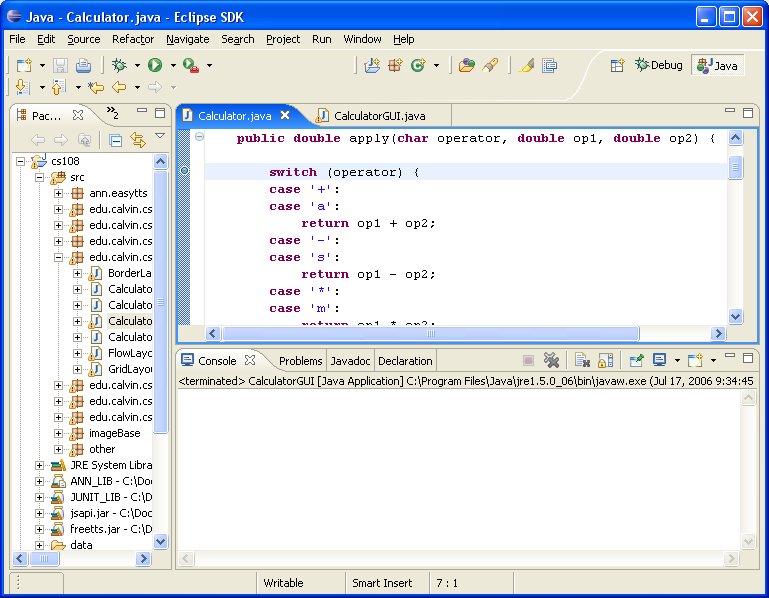
Note the small blue/aqua circle to the left of the switch statement. This
indicates that the debugger has set a breakpoint at this statement.
In the middle of the debugger view, you’ll see a code window with the
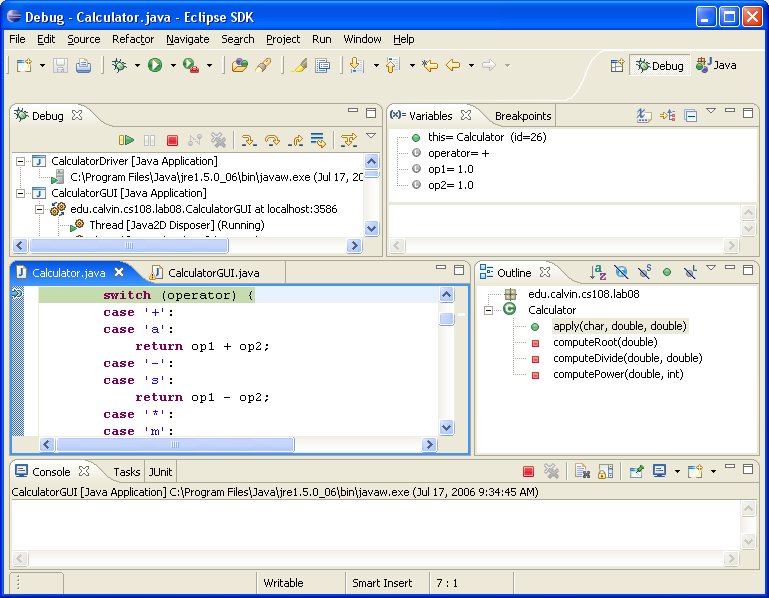
switch
statement highlighted. This means that the debugger has stopped execution of the program just
before running this statement. You may have to input data or do other user interface actions before
the code gets to this point. You may now do any of the following:
- Control - Control Execution using the tool-bar in the
“Debug” window:
- Resume execution - The green arrow is the “Resume” button (see the tool tips to find the right one. Pressing this will resume execution of the program until the next breakpoint is encountered.
- Terminate execution - The red square in the “Debug” tool bar will stop execution of the debugger.
- Step Into - The yellow arrows will cause the debugger to execute the “next” statement. The smaller of the two yellow arrows, Step Into, will step to the first statement in the method if a method is being called; this is useful when you want to debug the method.
- Step Over- The longer of the yellow arrows, will execute the method and then step to the next statement after the method call; this is useful when you’re confident in correctness of the method being called.
- Step Return- The third of the yellow arrows, will execute the remainder of the current method and then step to the next statement after the method call.
-
Data Inspection - Inspect data values using the “Variables” window on the upper right. Some of the data values may be internally complex; in this case the data window will provide a hierarchical view of the data objects.
-
I/O - Perform I/O as required by the program either in the GUI or in the “Console” window at the bottom as appropriate.
-
Debug and Java Views -Switch back to the standard “Java” view to modify the program using the “Java” button in upper right.