1.
Alignments as Sequences of Deletions, Insertions, and Substitutions
Mathematically,
the pairwise DNA-sequence alignment problem begins by providing two
sequences S1 and S2 composed from the four
characters A, C, G, or T. The following sequences present an example:
S1:
AGTGTTCCAG
S2: AATCGTTACAG
An
alignment of two sequences is a record of “edits” (or lack
thereof) in the bases in S1 that leads to the sequence S2.
Allowable edit operations are:
Deletion
(D): delete a base
Insertion
(I): insert a new base
Substitution
(S): replace a base with another base
Notice
that a substitution may not represent an actual “edit” as it does not
rule out that a base may be “replaced” by exactly the same base.
Biologically, the latter would correspond to a match. A substitution
reflecting an actual change of the base would correspond to a
mutation.
Example
1. Below
are some possible alignments of the sequences S1 and S2.
Modified strings M1 and M2 represent insertions and
deletions by placing a hyphen (-) into S1 for an insertion,
and into S2 for a deletion.
We will refer to M1 and M2 as the alignment strings
of an alignment.
We can also represent an alignment as a list of edit operations L.
The sequence L represents the transformation of S1
into S2 by enacting the edits listed in L on S1
from left to right.
L is called the edit string of the alignment.
-
M1: A-GTGTTCCAG
M2: AATCGTTACAG
L: SISSSSSSSSS (1 insertion, 9 substitutions, 0 deletions) -
M1: -AGT-GTTCCAG
M2: AA-TCGTTACAG
L: ISDSISSSSSSS (2 insertions, 8 substitutions, 1 deletion) -
M1: ---------AGTGTTCCAG
M2: AATCGTTACAG--------
L: IIIIIIIIISSDDDDDDDD (9 insertions, 2 substitutions, 8 deletions)
□
The curious reader may wonder why the same letter (S) is used to indicate
both an exact match and a mismatch substitution. The distinction between
an exact match and a mismatch substitution is indeed important, and the
alignment tool BLAST represents this
distinction by placing vertical lines between the exact matches as
in the example below.
This is the only condition placed on an edit string.
In other words,
if #I, #D, and #S denote respectively the number of insertions,
deletions, and substitutions in the sequence L, then A
sequence L represents a valid edit string for S1 and S2 if and only if
Exercise 1. Are all three alignments
in Example 1 of equal biological importance? Explain why or why not. Exercise 2. Verify that the conditions
#I + #S = 10 and #D + #S = 11 are satisfied for all of the
alignments presented in Example 1. Exercise 3.
Let S1 and S2 be the same sequences as above.
Which of the L's below represent a valid alignment of S1 and S2?
Explain why or why not.
For each valid edit string give
the alignment strings M1 and M2
as was done in Example 1. a)
L:
SSSISSSSSSS b)
L:
ISSSSSSSSSS c)
L:
SSSDSSSSSSII d)
L:
SSIDSSSIDISS 2.
Alignments as Paths on a Graph Once
an alignment is understood as a sequence L formed of the characters I,
D, and S, a more visual way to represent that alignment is to view it
as a path on the alignment graph of the sequences of S1
and S2. If S1 has length m
and S2 has length n, the alignment graph is a given
as triangular lattice of height m and width n such as
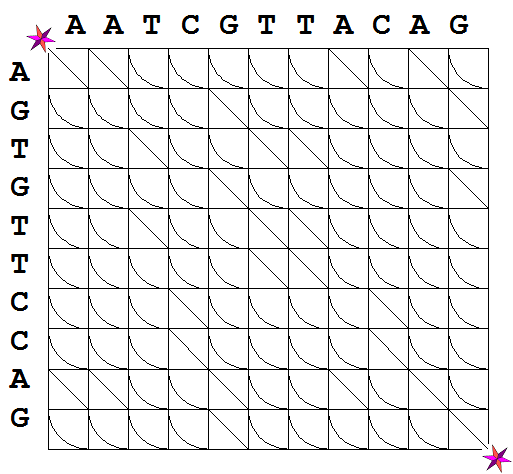
that in Figure 1. The DNA bases in S1 label the rows of the
lattice while the DNA bases in S2 label the columns. The
alignment graph of our example sequences S1 and S2
is presented in Figure 1A. Figure 1. An Alignment Graph.
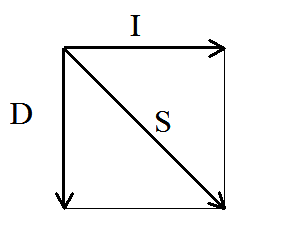
The
alignment graph is a directed graph. In directed graphs, access
from one vertex to an adjacent vertex via a connecting edge is allowed
only in the specified direction. For the alignment graphs we just
described, the possible directions are: one horizontal step from left
to right; one vertical step from top to bottom, and one diagonal step
from the upper left to the lower right corner. These possibilities are
depicted in Figure 1B. A path between two
vertices on the alignment graph is a walk along the edges of the graph
in the permissible directions that connects these two vertices. In what
follows we will only be interested in paths on the alignment graph from
the upper left to the lower right vertices of the graph. In Figure 1A
those vertices are marked by the symbol
The
following should now be clear:
Exercise 4. In Figure 2, trace the
paths that correspond to the alignments from Exercise 1a) and 1c).
3.
Alignments as Weighted Paths on a Graph Although
every path on the alignment graph between the upper left and lower
right vertices corresponds to an alignment, there are many paths that
correspond to biologically meaningless alignments. For instance, a path
that goes straight down to the bottom of the graph and then all the way
to the right can be used to align any two sequences, even when there
may not be a single base-pair match. On the other hand, alignments
corresponding to paths with more diagonal steps are more likely to
produce biologically meaningful matches. The goal is to find alignments
that have high biological likelihood. One
way to approach this problem is to assign a cost (also
sometimes referred to as penalty or weight) to each of
the edges in the alignment graph with exact matches incurring no cost.
Insertions, deletions and actual substitutions of bases, on the other
hand, are performed at a cost. The actual values of the penalties are
based on biological considerations. In this project, we use the
following very simple penalty scheme to illustrate the concept.
Figure 3. Distinguishing between
substitutions: an
exact match is represented by a diagonal arrow (left panel) and a
mutation is
depicted by and arc (right panel).
Figure 4. Panel A: The weighted
alignment graph for
the sequences S1 and S2;
The
alignment graph with designated costs for each of its edges is the weighted
alignment graph for the sequences S1 and S2.
The cost of a path is defined as the sum of the costs of
all of its edges. Example
2. The cost
of the red path in Figure 4B is 9x + 5p. To see this,
notice that the path corresponds to an alignment that contains 5
insertions (corresponding to five vertical edges), 4 deletions
(corresponding to the total of horizontal edges in the path), 5
mutations and 1 exact match. Recall that that the cost of any
insertion/deletion is x, the cost of a mutation is p, and
the cost of an exact alignment is zero. Adding the individual
weights for all edges in the path establishes the claim. □ Exercise 5. Find the costs of the blue
and black paths depicted in Figure 2A. Clearly,
the optimal alignment will correspond to a path of minimal cost. Thus,
This
problem may not seem too difficult at first glance, since the alignment
graph has a finite number of edges. The following natural strategy, however,
does not work in practice:
Fortunately, the
mathematical problem of finding the paths of minimal cost on weighted
graphs is a classical problem, and a number of computationally efficient
solution strategies and algorithms are available. An important feature
of these algorithms is that they do not need to compute the
costs of all paths
in a graph to find the shortest path.
Dijkstra's algorithm
is a well-known algorithm that works efficiently on any weighted directed
graph.
The Needelman-Wunsch algorithm is a special verion of this algorithm
that can be used in our situation because alignment graphs have special properties.
(The important properties here are that (1) the vertices can be laid out in a
rectangular grid, and (2) all edges go down and/or to the right.)
We will not discuss here the details of these algorithms as
they can be found in many
introductory books on
discrete mathematics or algorithms and data structures.
Instead, we have included an
interactive applet that
implements a shortest path algorithm and allows for changeing the costs x
and p and observing how these changes affect the optimal alignment.
In closing, we emphasize that we have now
described four equivalent ways of representing an alignment of two
sequences S1 and S2:
        A-GTGTTCCAG
        |   ||| |||
        AATCGTTACAG
The advntage of a coding scheme that uses S for both matches and mismatches
is that it is easy to check by simple counting
whether a given edit string (L) is a valid edit string.
Consider the following edit string
IISDSSDSI
Each S in the edit string adds one character to each sequence,
each I adds a letter only to the second sequence, and each D adds
a ltter only to the first sequence. So the first sequence must have
4 + 2 = 6 letters, and the seond must have 4 + 3 = 7 letters.
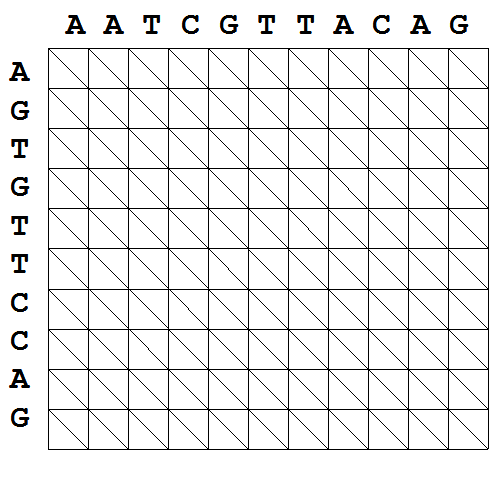
Panel B
Panel A: The alignment graph of the
sequences S1 and S2.
In this case m = 10 and n = 11.
Panel B: Possible directions on the graph from a vertex to an adjacent
vertex. .
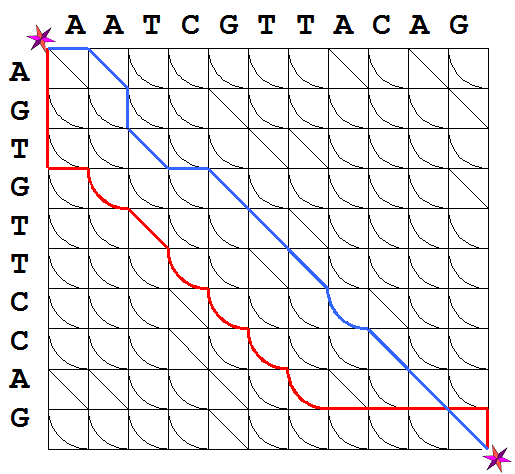
Many such paths exist, of course. Figure 2 depicts three paths that
connect these vertices.
.
Many such paths exist, of course. Figure 2 depicts three paths that
connect these vertices.
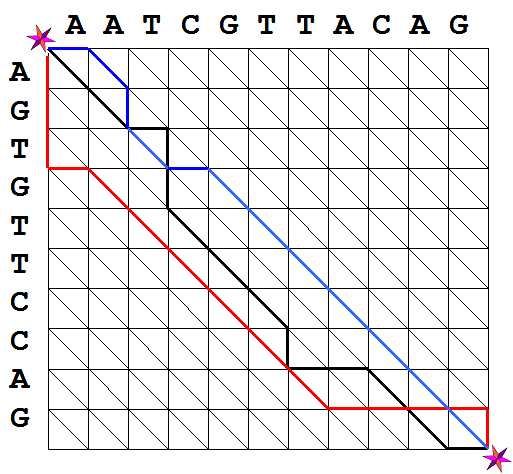
Figure 2. Possible
paths in the alignment graph.
The blue path corresponds to the alignment
presented in Exercise 1b).
Consider
now Figure 1B again. If for any path on the alignment graph, a record
is made for the directions followed on each step, using the labels D,
I, and S, as depicted in the figure. Each path on the alignment graph
represents a sequence formed from these three characters. The
black path in Figure 2 then corresponds to the edit sequence L: SSIDDSSSDIISSI and the red path
corresponds to L:
DDDISSSSSSIIIID. Notice that for these paths
#I + #S = 10 and #D + #S = 11. The opposite is also true: any sequence
formed of the characters D, I, and S for which #I + #S = 10 and #D + #S
= 11, defines a path between the upper left and lower right vertices of
the alignment graph. For instance, the blue path in Figure 2 represents
the alignment of S1 and S2 defined in Example
1b).
Any alignment of two sequences S1 and S2
can be represented by a path from the upper left to
the lower right vertices on the corresponding alignment
graph.
Furthermore, any such path represents an alignment.
A good way to visualize these is to consider a refined version of the
alignment graph where we can distinguish between exact matches and
mutations within the group of substitutions. Figure 3 is a modified
version of Figure 1B. Now, either a diagonal or an arc depicts a
substitution. A diagonal edge represents an exact match (Figure 3, left
panel). A directed arc depicts a mutation (Figure 3, right panel).
The longer length of the arc is intended to indicate the greater cost of
taking this path.
As before, any vertical edges correspond to deletions and horizontal edges
correspond to insertions.
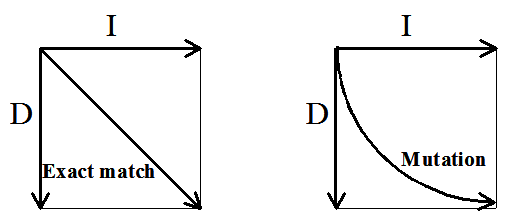
Figure 4A depicts the alignment graph of S1 and S2
that utilizes straight diagonals for exact matches and arcs for
mutations. Figure 4B depicts the red and blue paths
from Figure 2 on this more refined graph.
Panlel A
Panel B
Panel B: The weighted paths on the graph
corresponding, respectively, to the red and blue paths from Figure 2.
Finding an optimal alignment is the same as determining
a path of minimal cost on the weighted alignment graph.
The reason this idea does not work is that the number of paths in such a graph
grows extremely rapidly with the increase of
the sequences’ lengths, and the task quickly becomes computationally
overwhelming. It can be shown that there are 224,143 different paths
from the upper left to the lower right verteces on the alignment graph
of two sequences of length n = 7 and m = 9. When, as is common in biology,
we are attempting to align sequences that may be hundreds of bases long,
making a complete list of all paths becomes intractable.
1
standing for insertions and hyphens in S2
for deletions;