Generalization and Tasks
Monday
What’s the biggest danger of AI?

Source: pixabay
Emergent Strategy and Safety
- No behaviors were programmed in. Where did the strategies come from?
- What are some real-world analogies to “box surfing”?
- In light of emergent behavior, what laws and policies should we have for AI safety?
AI Safety
Unexpected behavior can emerge from optimizing an objective.
- Optimized systems fail in different ways than human-engineered systems.
- Mimics (like GPTs) learn a surprising amount without interaction
- The “human feedback” part of GPT training mostly upvotes/downvotes what’s already learned.
- Interaction makes systems be able to exhibit even more surprising behavior
Responsibility
If anyone uncovers a pit or digs one and fails to cover it and an ox or a donkey falls into it, the one who opened the pit must pay the owner for the loss and take the dead animal in exchange.
If anyone’s bull injures someone else’s bull and it dies, the two parties are to sell the live one and divide both the money and the dead animal equally. However, if it was known that the bull had the habit of goring, yet the owner did not keep it penned up, the owner must pay, animal for animal, and take the dead animal in exchange.
Exodus 21:33-36 (NIV)
Lab Review
Discuss with a different person than last week:
Explain how
feature_vectors @ weight_matrixcomputes how much each image is like each of the prototypes. Discuss both whatfeature_vectorsrepresents and whatweight_matrixrepresents – and how the matrix multiply computes similarities.If we wanted to predict a single number (e.g., the number of petals on the flower), what would the shape of the weight matrix be?
Applications
Recommender Systems
Collaborative Filtering
- Goal: predict how much a user will like an item (movie, book, song, etc.)
- “Collaborative”: based on what other users have done
- “Filtering”: lots of possible items; find the few relevant ones

RecSys Data
Imagine the data tables that YouTube might be using. What are the columns? Rows?
RecSys Data
| timestamp | Viewer | Video | Watch time | |
|---|---|---|---|---|
| 1616963421 | UC2nEn-yNA1BtdDNWziphPGA | WK_Nr4tUtl8 | 600 | |
| 1616963422 | UCYO_jab_esuFRV4b17AJtAw | aircAruvnKk | 1153 | |
| … | … | … | … |
- Tabular
- Categorical features with high cardinality
- Lots of viewers!
- Lots of videos!
Core Idea: Similarity
- Find examples where people like you
- … watch videos like the ones being considered
So we need a way to measure similarity for both users and items
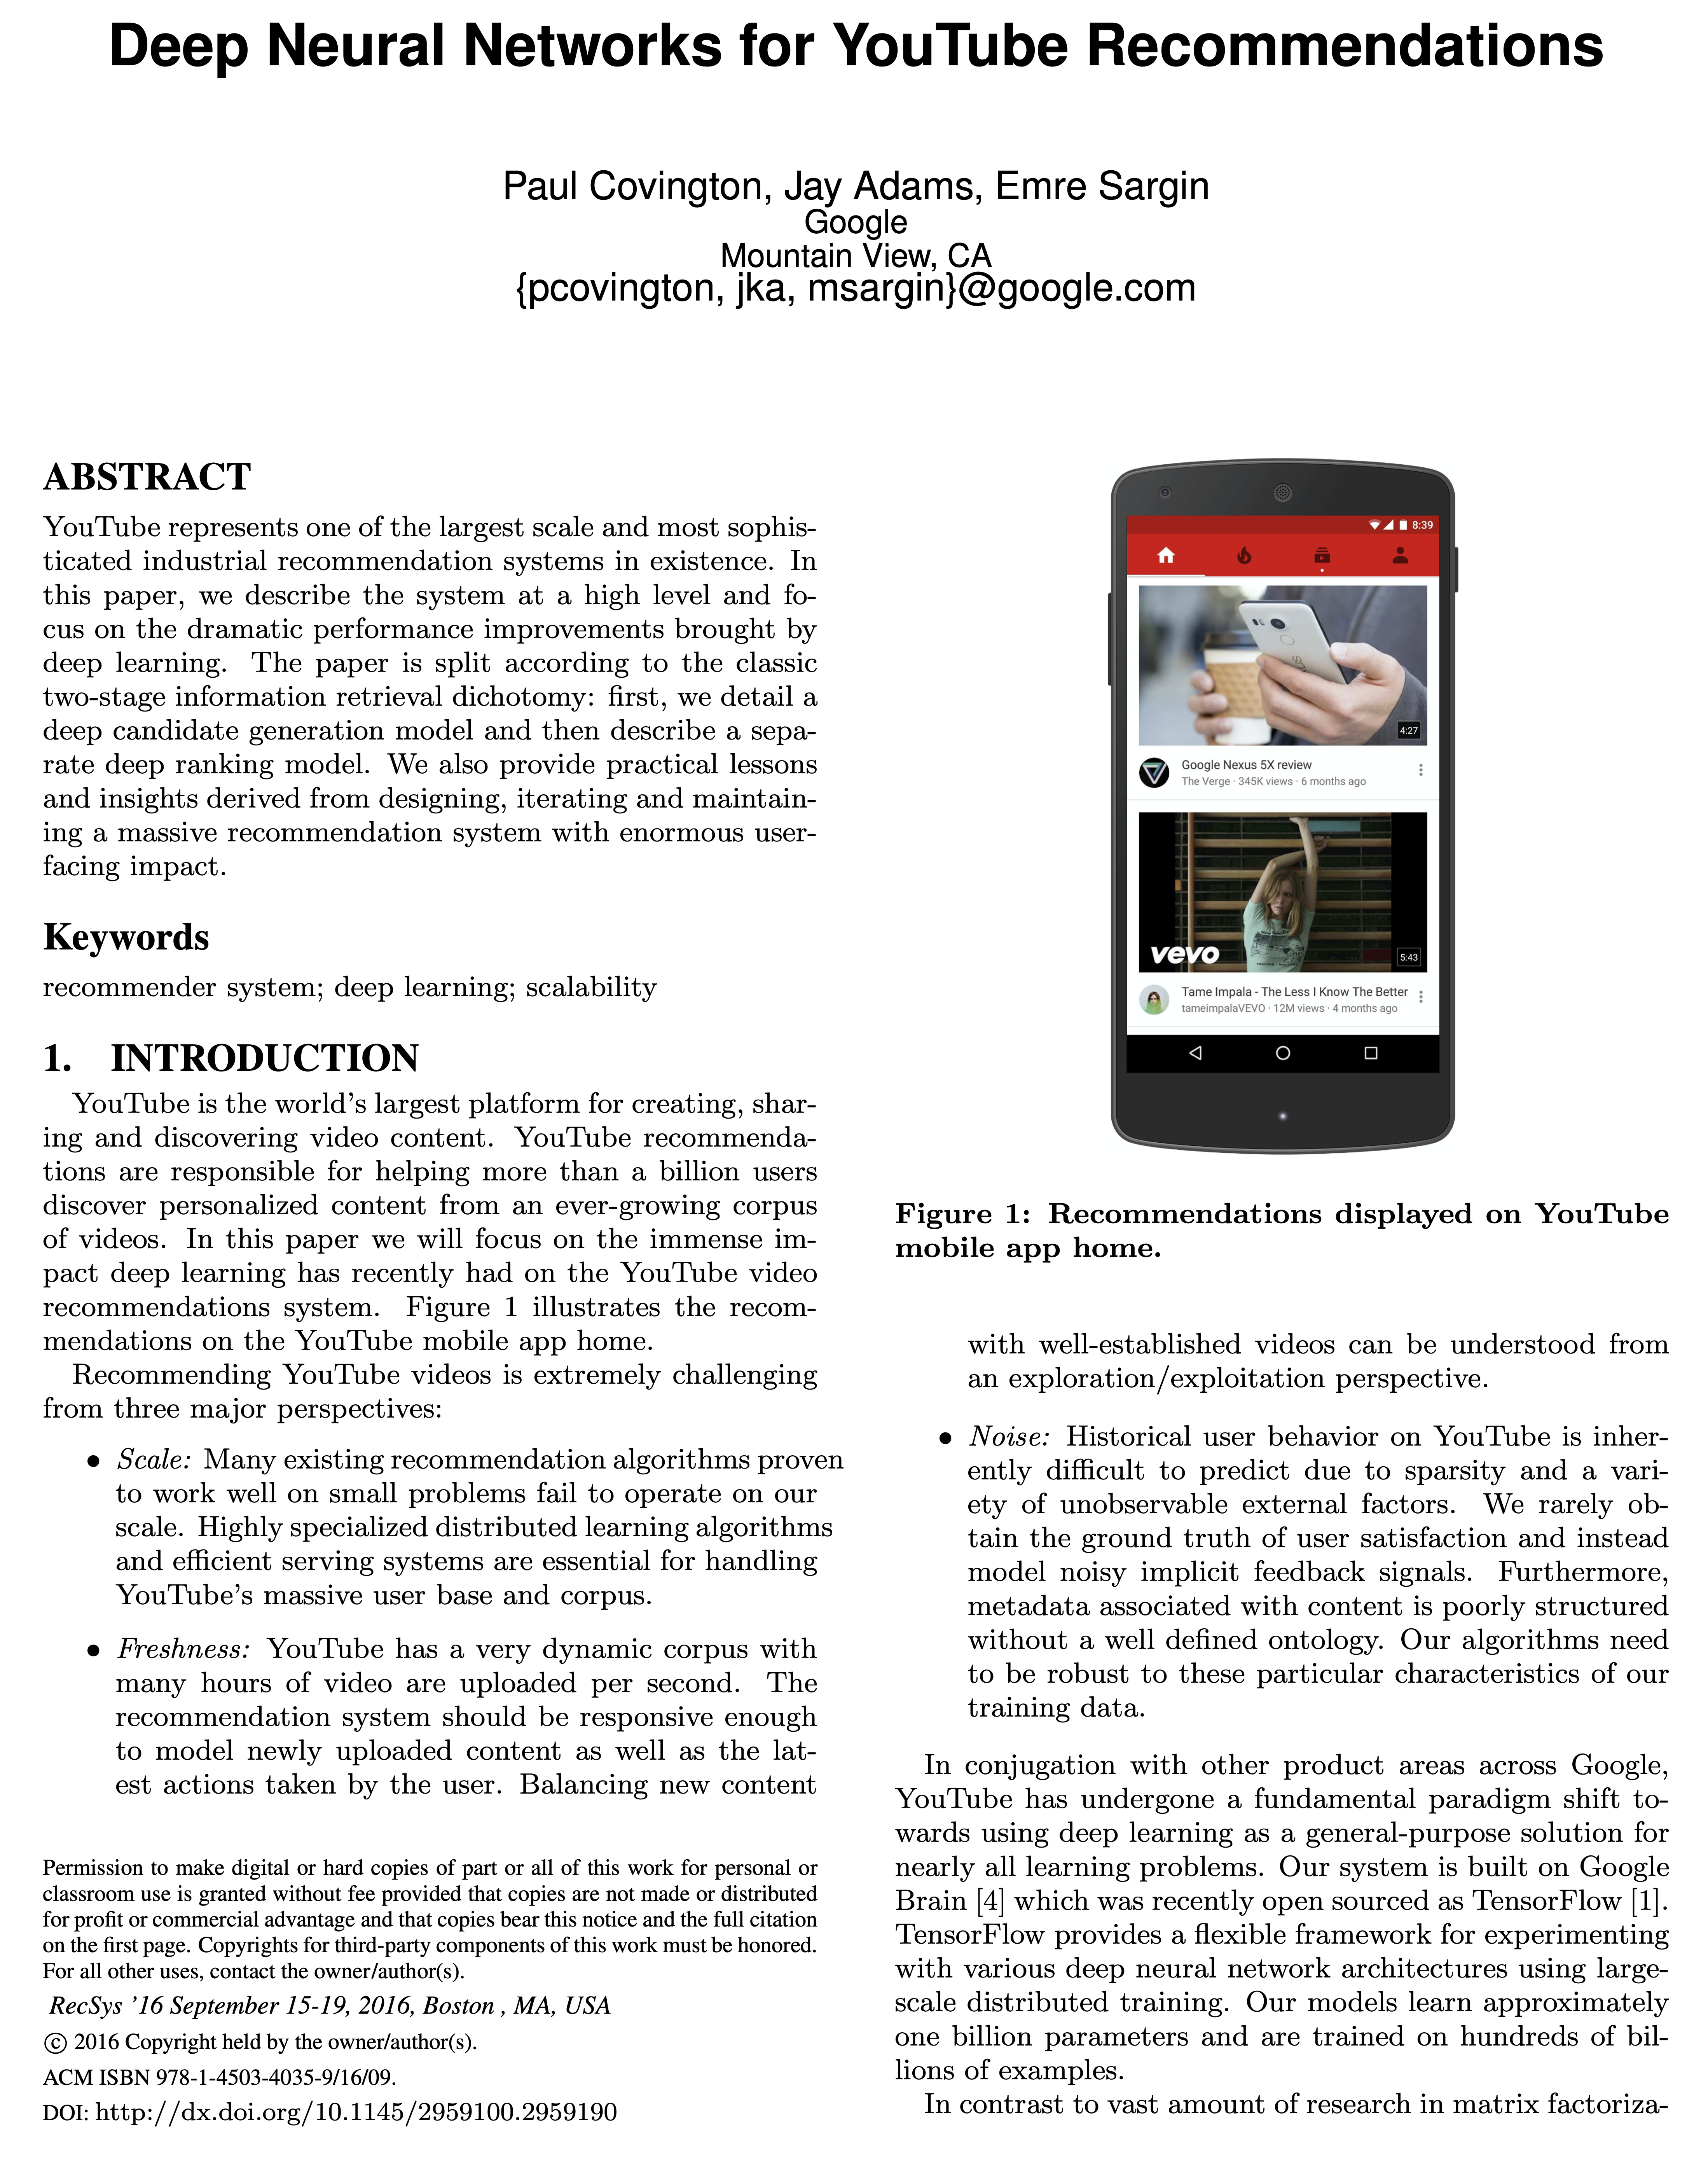
Live Experimentation
During development, we make extensive use of offline metrics (precision, recall, ranking loss, etc.) to guide iterative improvements to our system. However for the final determination of the effectiveness of an algorithm or model, we rely on A/B testing via live experiments. In a live experiment, we can measure subtle changes in click-through rate, watch time, and many other metrics that measure user engagement. This is important because live A/B results are not always correlated with offline experiments.
- They don’t use likes, surveys, etc., but rather watches.
- Why? Lots more data! “allowing us to produce recommendations deep in the tail where explicit feedback is extremely sparse.”
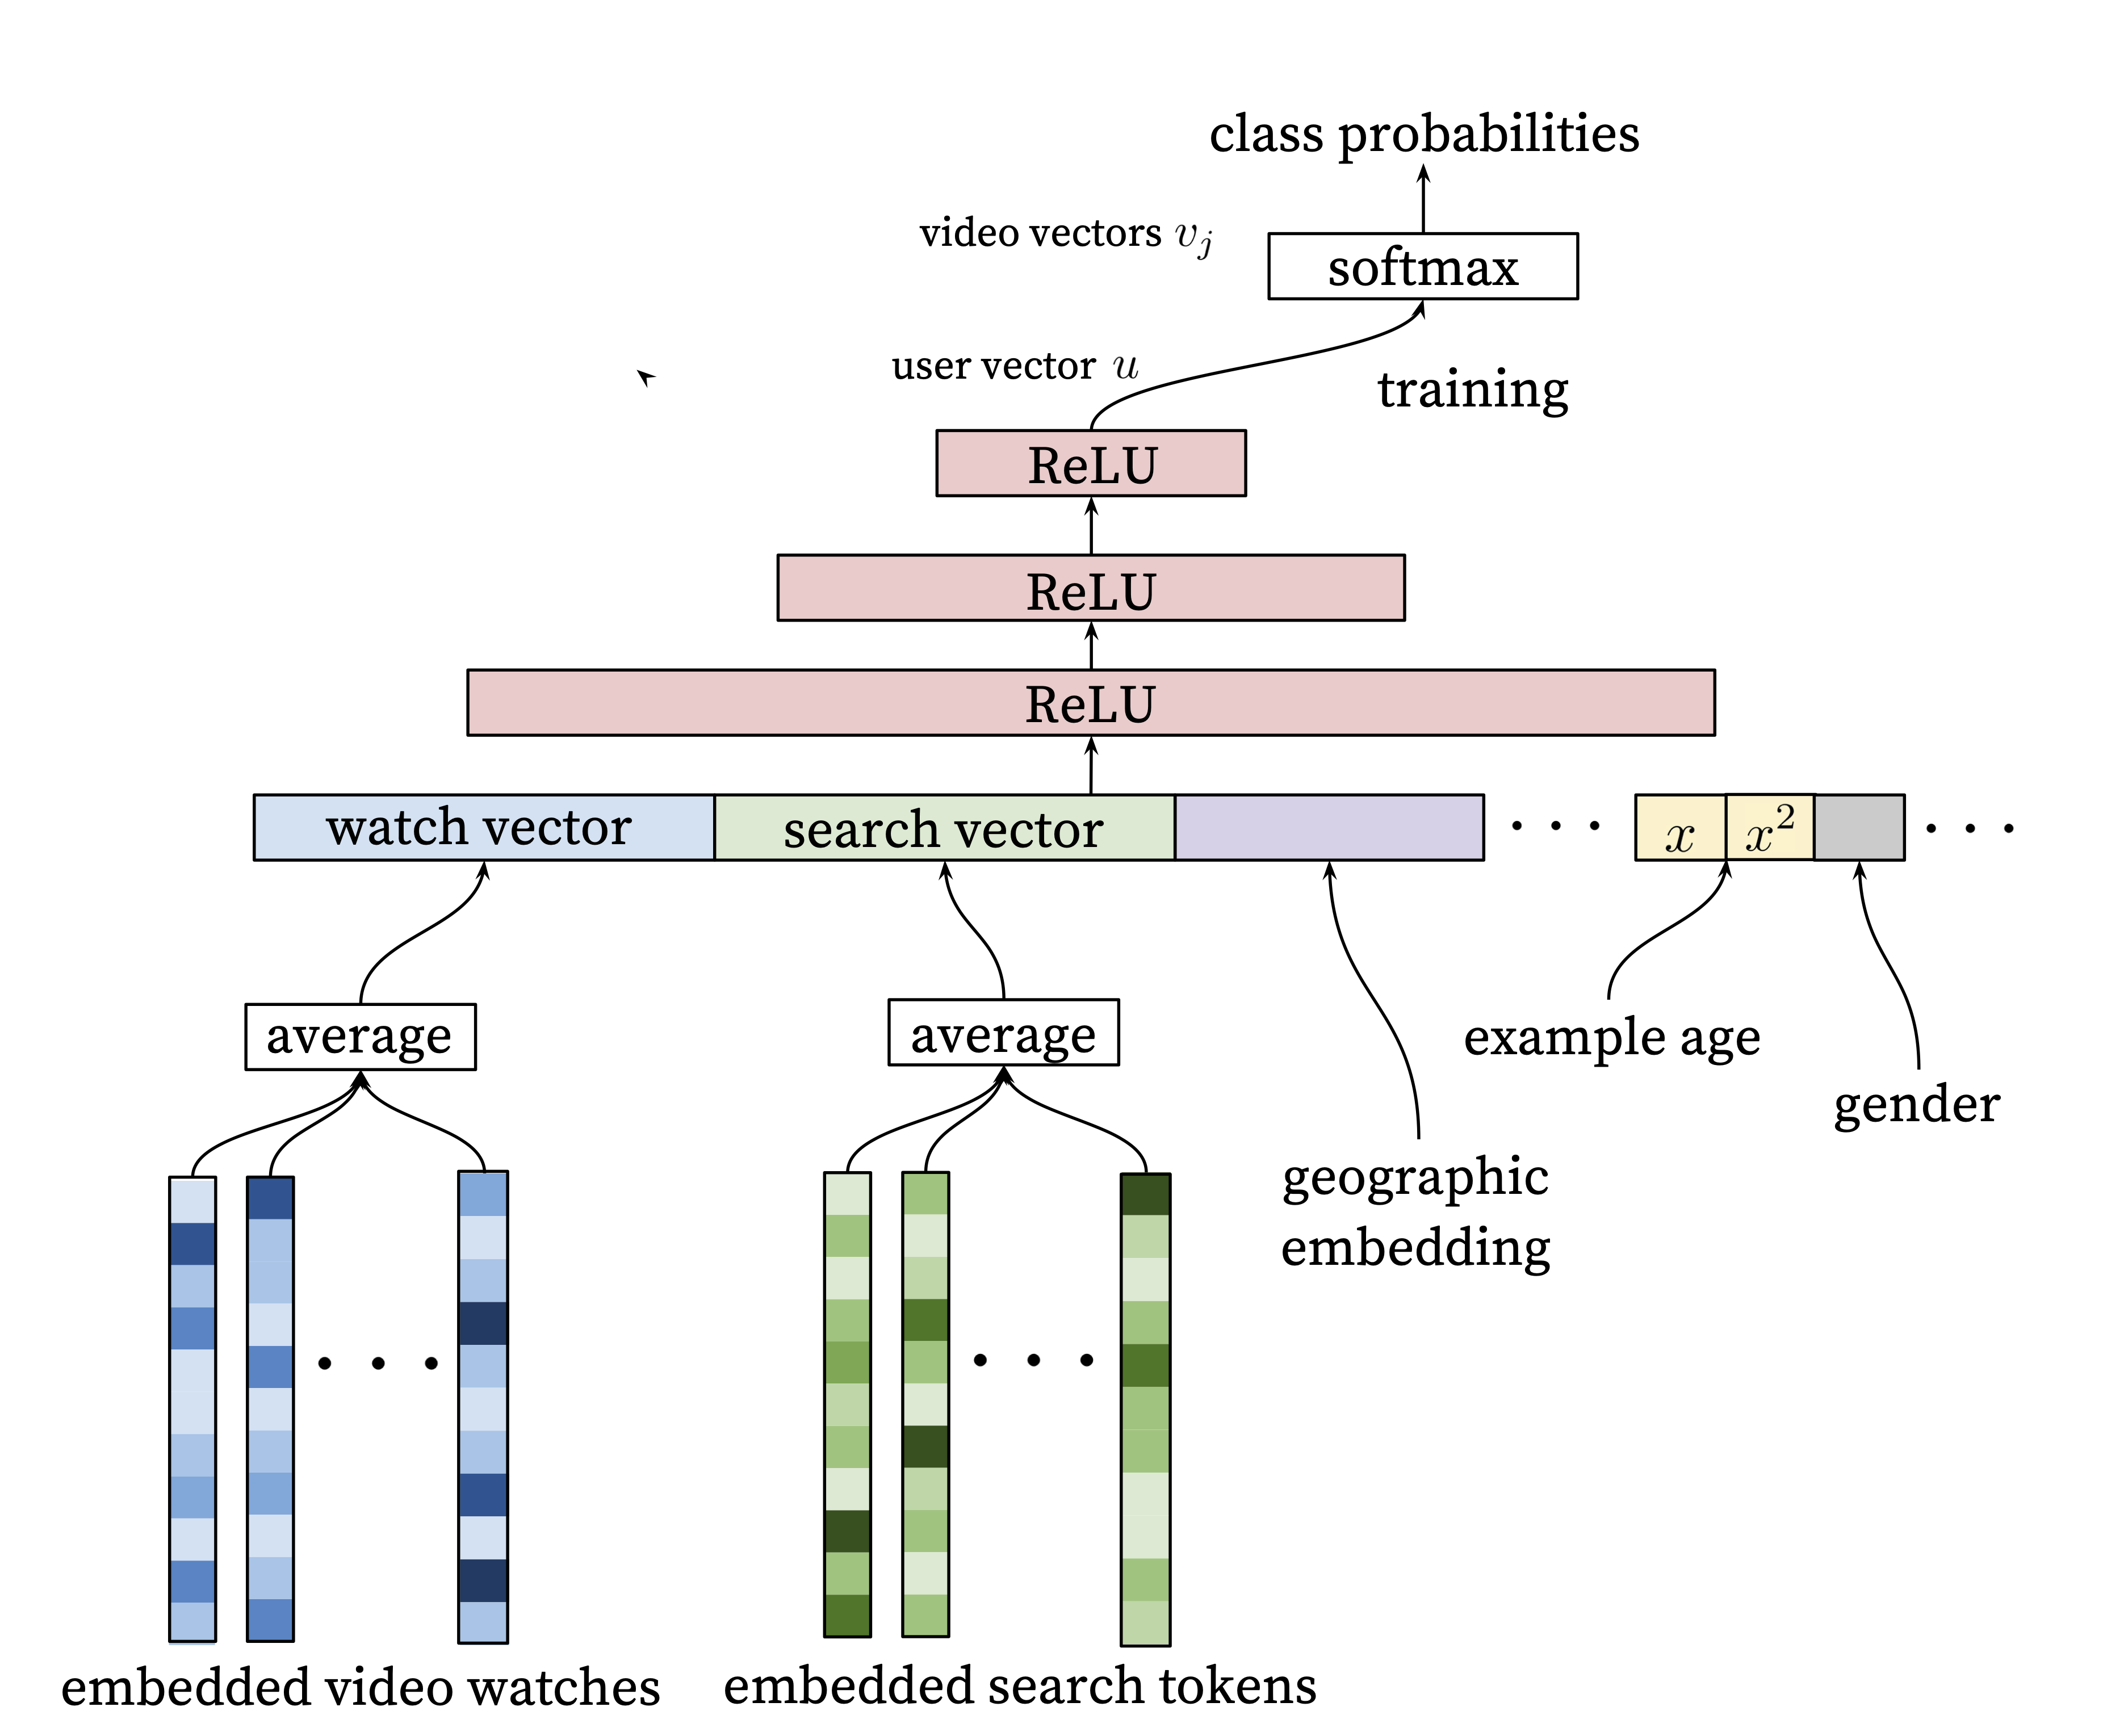
Approach: Embeddings
- Represent users and items as vectors
- Predict user-item interactions as dot products
- Learn these vectors from the data
Intuition:
- if two items are similar, their vectors should be similar
- if two users have similar tastes, their vectors should be similar
Text Classification
Text Classification
Key challenge: how to represent text data.
- A document has many words
- The number of words varies.
- The order of words matters.
- There are many possible words.
- …
Words to Numbers
- Split a document into words and punctuation (tokenization)
- Choose a “vocabulary” of words. (e.g., the 10,000 most common words)
- Represent each word with a unique number.
For words not in the vocabulary, use an “unknown word” token.
Bag of Words
- Count the number of times each word appears in a document.
- Equivalently: one-hot encode each word, sum the one-hot vectors.
Bag of Words Example
Vocabulary: [“the”, “cat”, “dog”, “is”, “on”, “under”, “table”]
Document: “the cat is on the table”
Bag of words: [1, 1, 0, 1, 1, 0, 1]
Document: “the dog is under the table”
Bag of words: [1, 0, 1, 1, 0, 1, 1]
Simple Classifier
- Logistic regression (one-layer network) on bag of words
- weights for each word: how much does a document having that word affect the classification?
- example for sentiment: positive weight for “good”, negative weight for “bad”, near-zero weight for “the”
- Two-layer network: first layer extracts co-occurrence features
- e.g., “good” vs “used to be good”
Limitations of Bag of Words
- Ignores word order
- “the cat is on the table” vs “the table is on the cat”
- simple solution: n-grams (e.g., “the cat”, “cat is”, “is on”, “on the”, “the table”)
- general solution: sequence models (e.g., recurrent models, convolutional models, transformers)
- Ignores word meaning (e.g., considers “good”, “great”, “yuck”, and “bad” as equally different words)
- solution: word embeddings
Word Embeddings
Task: given a single word, predict the next word
- “red lentil chili recipe”
- “red lentil curry recipe”
- “chickpea chili recipe”
- “chickpea” ___
What will you predict? How?
| word | lentil | chickpea | recipe |
|---|---|---|---|
| is an ingredient | 1 | 1 | 0 |
| is a legume | 1 | 1 | 0 |
| is a color | 0 | 0 | 0 |
| is information | 0 | 0 | 1 |
| described by an ingredient | 0 | 0 | 1 |
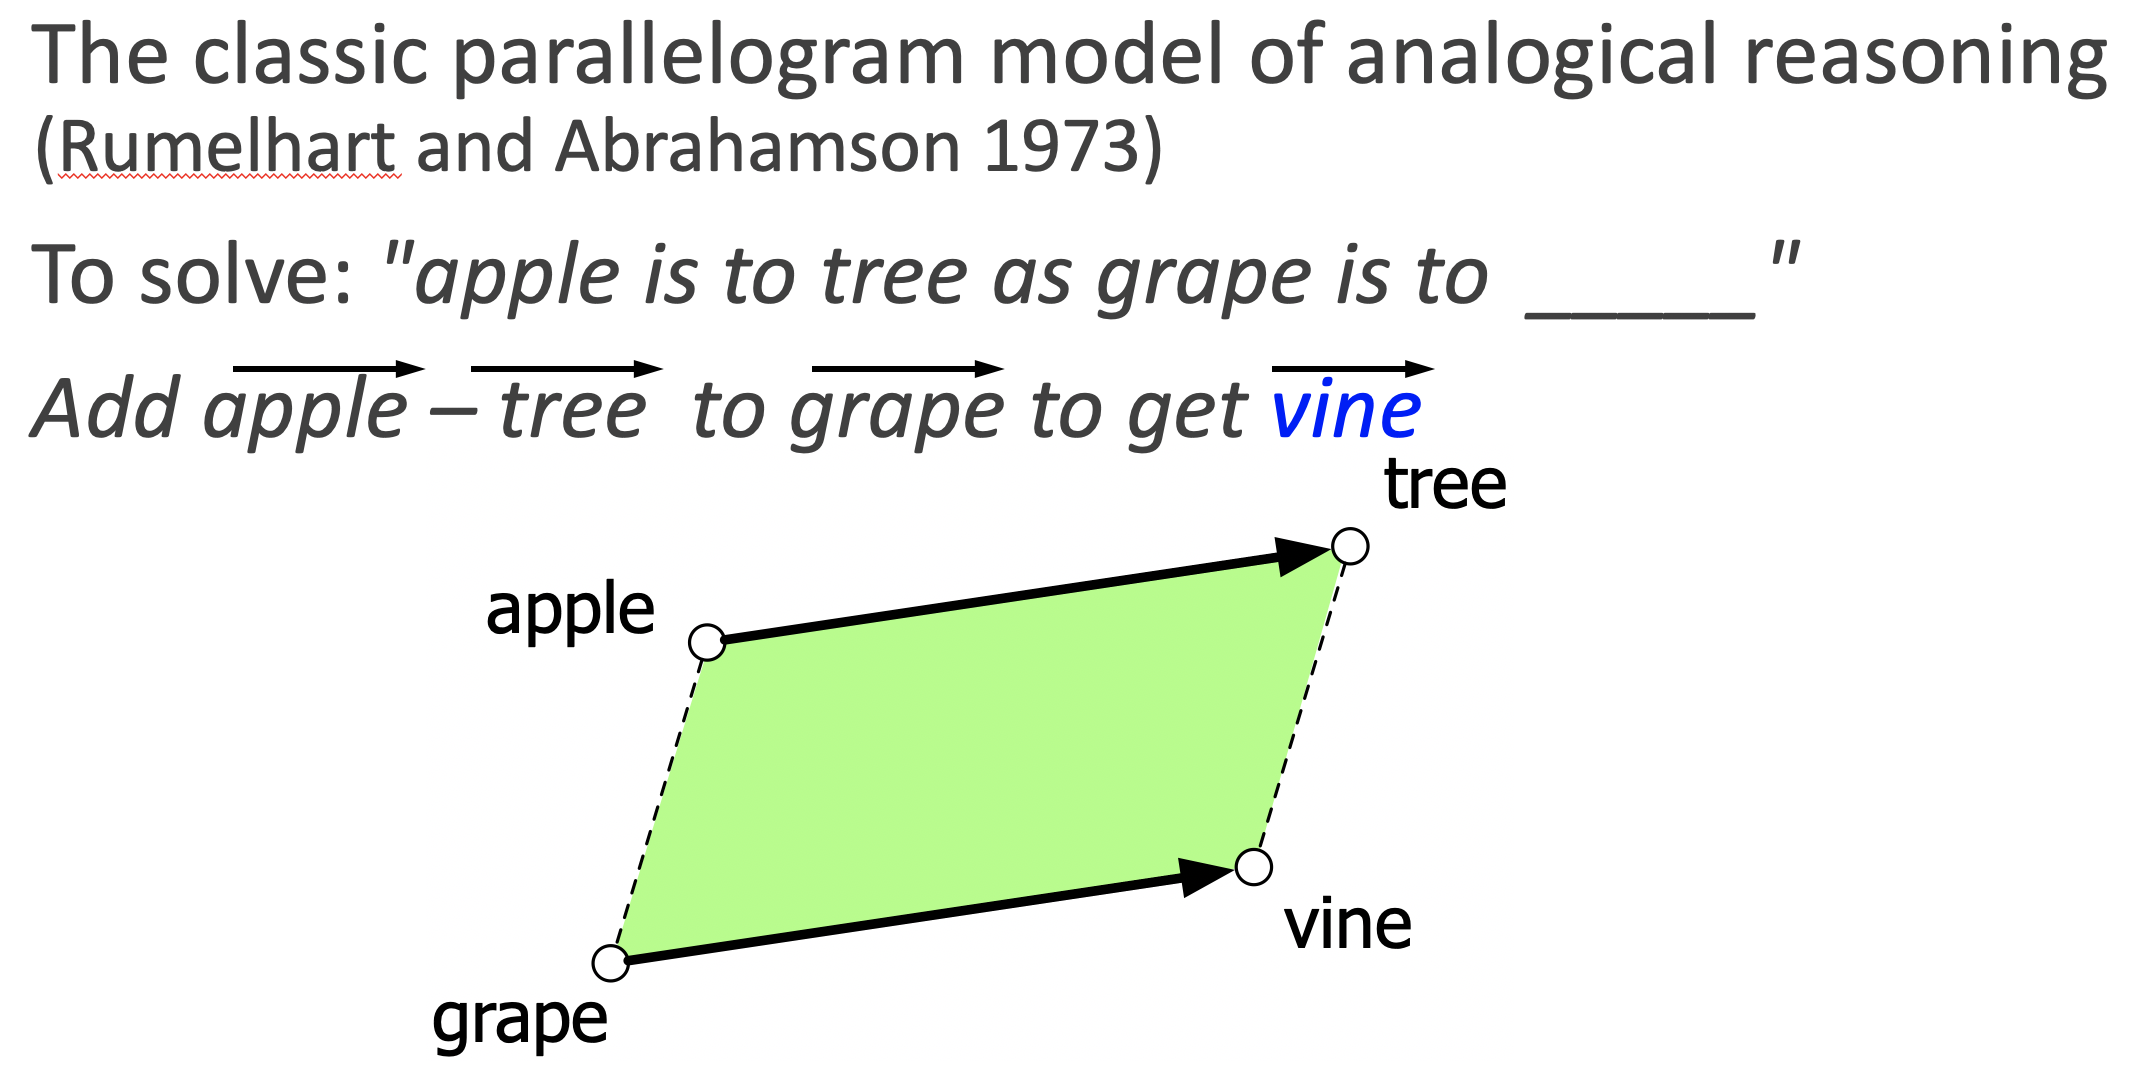
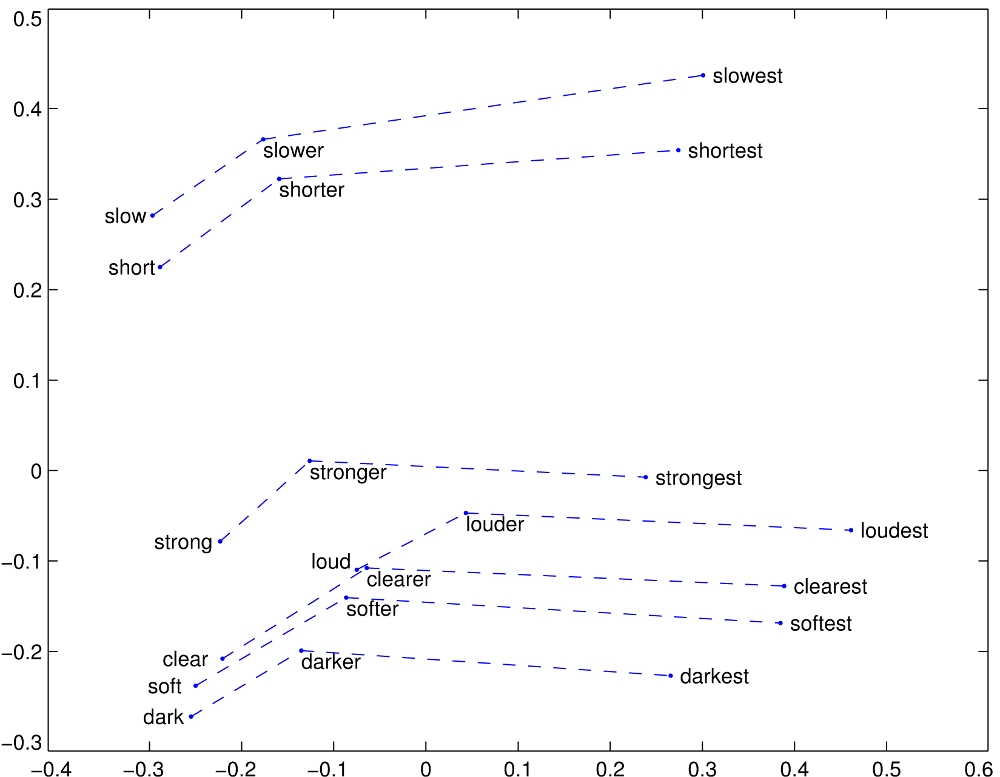
Where do those embeddings come from?
Option A: hire an army of linguists (and food experts etc.)
Option B: learn it from data.
- “The meaning of a word is its use in the language” - Wittgenstein
- “You know a word by the company it keeps” - John Firth, 1950’s linguist
Source: Jurafsky and Martin. Speech and Language Processing 3rd ed
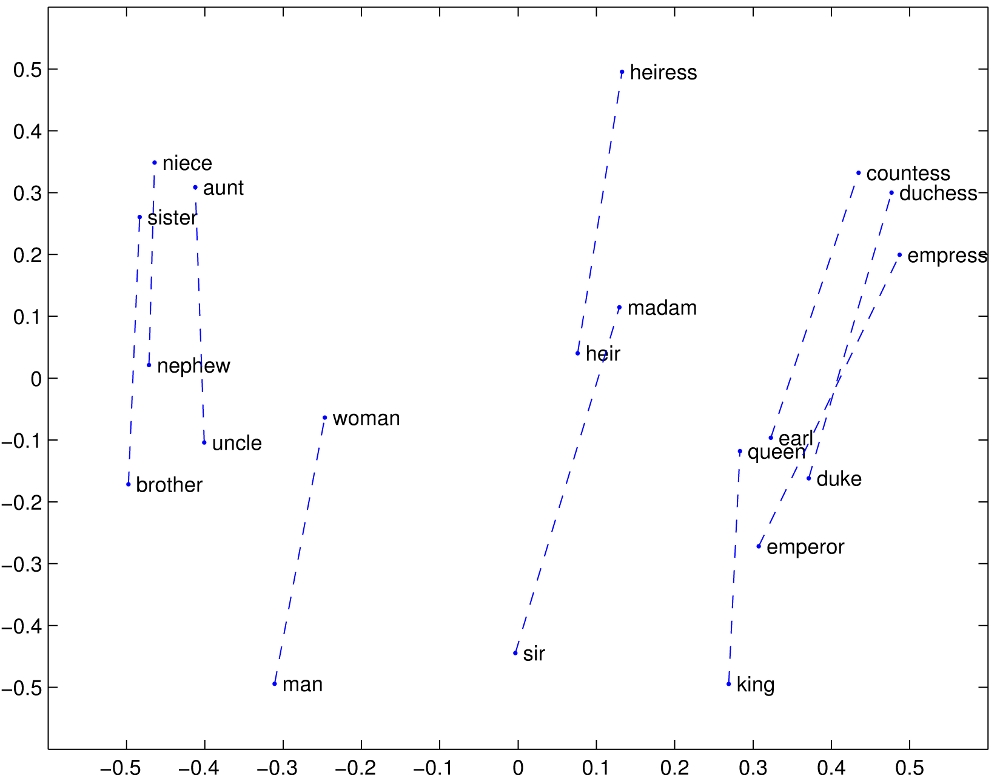
See also: Word embeddings quantify 100 years of gender and ethnic stereotypes (Garg et al, PNAS 2018)
Source: GloVe project
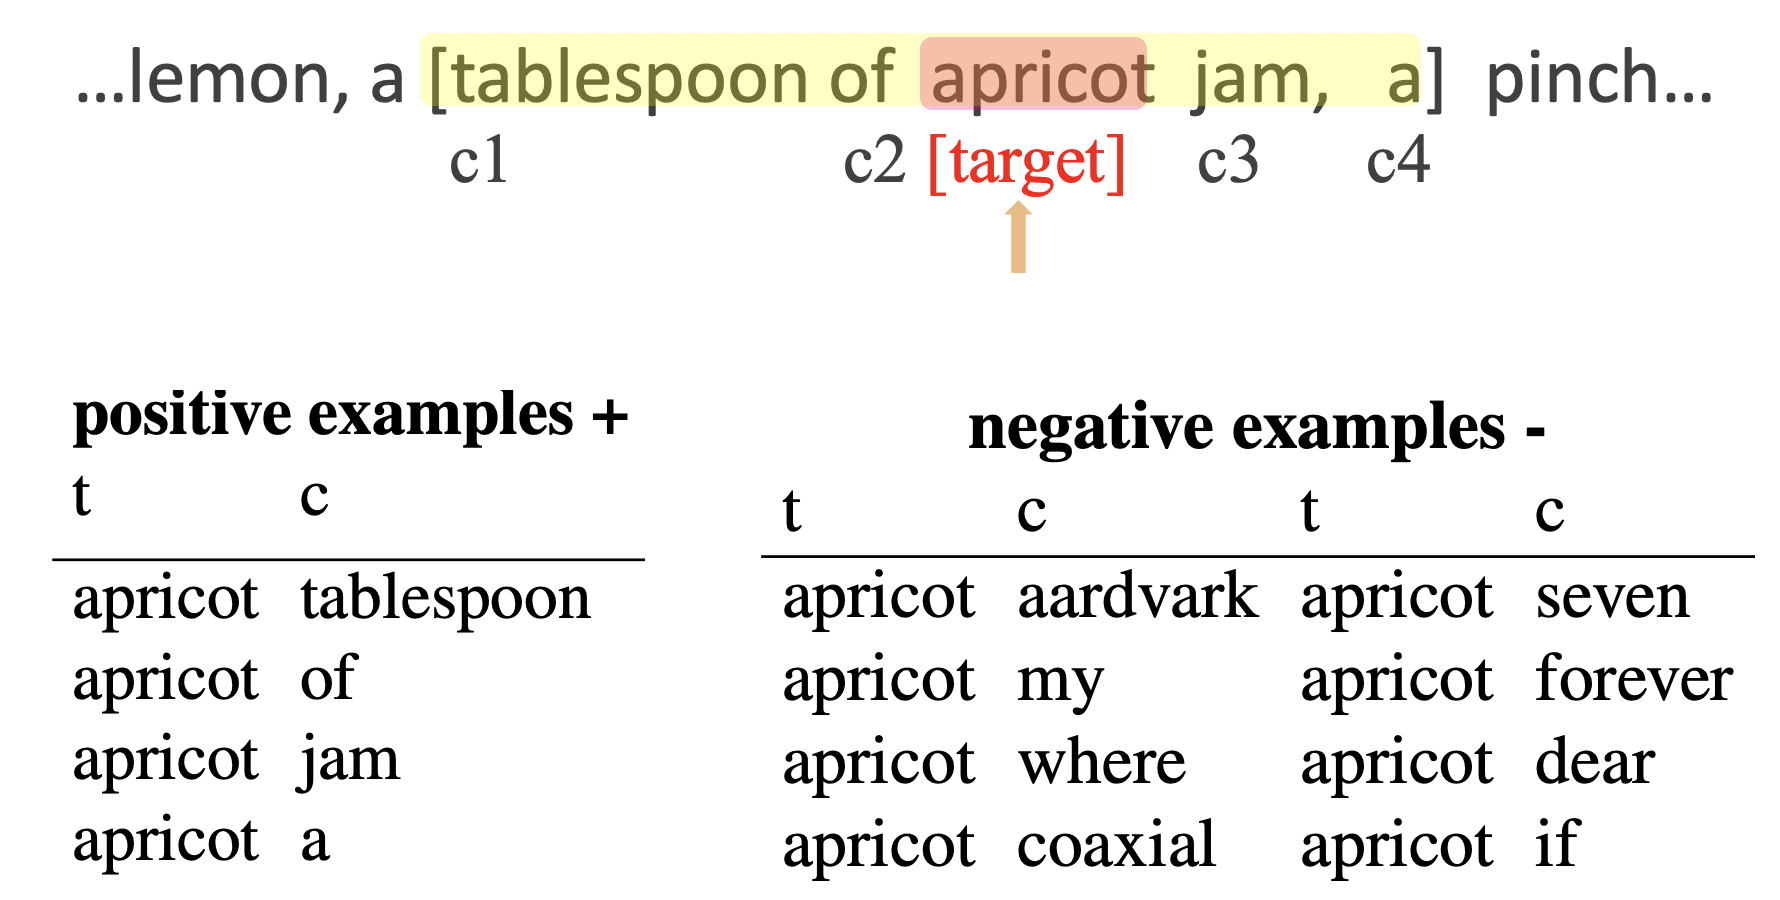
How does word2vec work?
Further Reading
Wednesday: Generalization
Recap Mini-Quiz
Which data do you absolutely need in your database for training a video recommender system based on collaborative filtering?
YouTube’s home-page recommender used embeddings to represent videos and users. What were these embeddings, and how were they used?
Which of these can be optimized by gradient descent: percent correct, precision, recall, MSE, MAE, categorical cross-entropy
Pattern Learning
Suppose you carefully study past exams and notice a pattern:
When the question includes the letter “m”, the answer is always “B”.
Is this a good pattern to learn?
- Can you get low loss on the practice exam?
- Will you do well on the real exam?
- List some ideas for how to improve your pattern-learning.
Why don’t models work as well on unseen data???
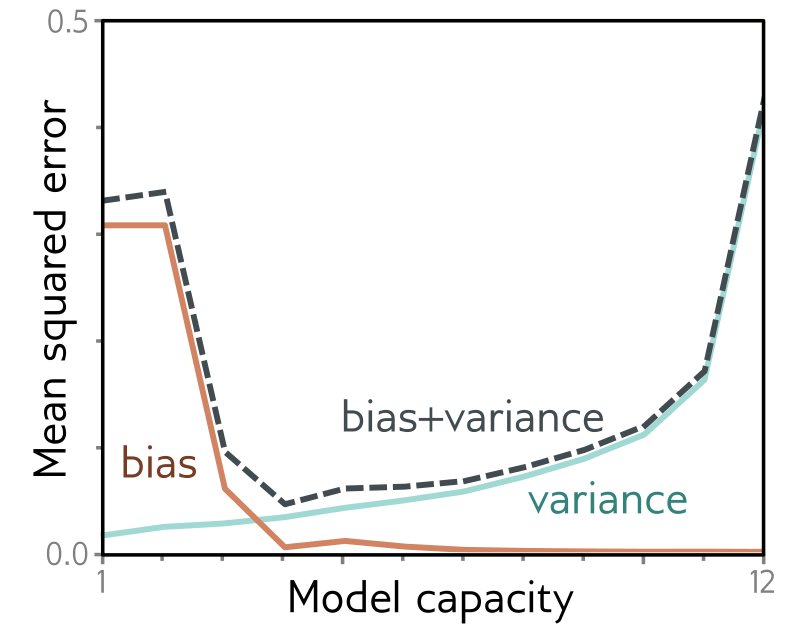
Bias-Variance Decomposition
Error = Bias^2 + Variance + “Noise”
(For MSE loss, this is a real equation–if we square the Bias term. For other losses, this decomposition is approximate.)
- Bias: Systematic error (e.g., a model that can only fit lines will have high bias when the data actually comes from a parabola).
- Usually beacuse the model is not expressive enough.
- Not like “bias” in “bias and fairness”.
- Variance: Error due to randomness in the training data. (e.g., a model that can fit any curve might have high variance when the data actually comes from a line.)
- Usually because the model is too expressive.
- Noise: Real variation in the world… not the model’s fault.
Technical Definitions
Imagine sampling many training sets and training a model on each. Compute all of those models’ predictions for a new sample.
- Bias (systematic error):
- Compute the average of all the models’ predictions.
- Bias = how far was that average from the true value?
- “This model could never learn the true relationship between inputs and outputs.”
- Variance:
- Compute the difference between each model’s prediction and the true value.
- Variance = mean square of those differences.
- “Different training sets make drastically different predictions.”
Bias-Variance Trade-off
Interactives
MLU-Explain on Bias and Variance - see the LOESS example.
Intuition
- Learning the real relationship between inputs and outputs is harder than learning a shortcut.
- Goodhart’s Law: “When a measure becomes a target, it ceases to be a good measure.”
Overfitting
Overfitting: When improving the model’s fit to training data doesn’t help it generalize.
Training dynamics can be a clue (e.g., validation loss starting to go up).
Usually because of increasing variance.
How to Mitigate Overfitting
- Get more data (reduces variance).
- Get more data.
- Regularize (avoid excesses).
Augmentation
- Get more data (reduces variance).
- Get more data: augment the data you have.
- Regularize (avoid excesses).
Avoiding Excesses
- excessive use of individual features might overfit to the training data
- solution: randomly drop out parts of the model
- why does this work? rest of the model learns to be more robust
- solution: penalize large weights
- why does this work? encourages the model to use all the features
- solution: randomly drop out parts of the model
- excessive confidence in predictions
- problem: might overfit to the training data, even mistaken labels
- solution: penalize probabilities that are too close to 0 or 1.
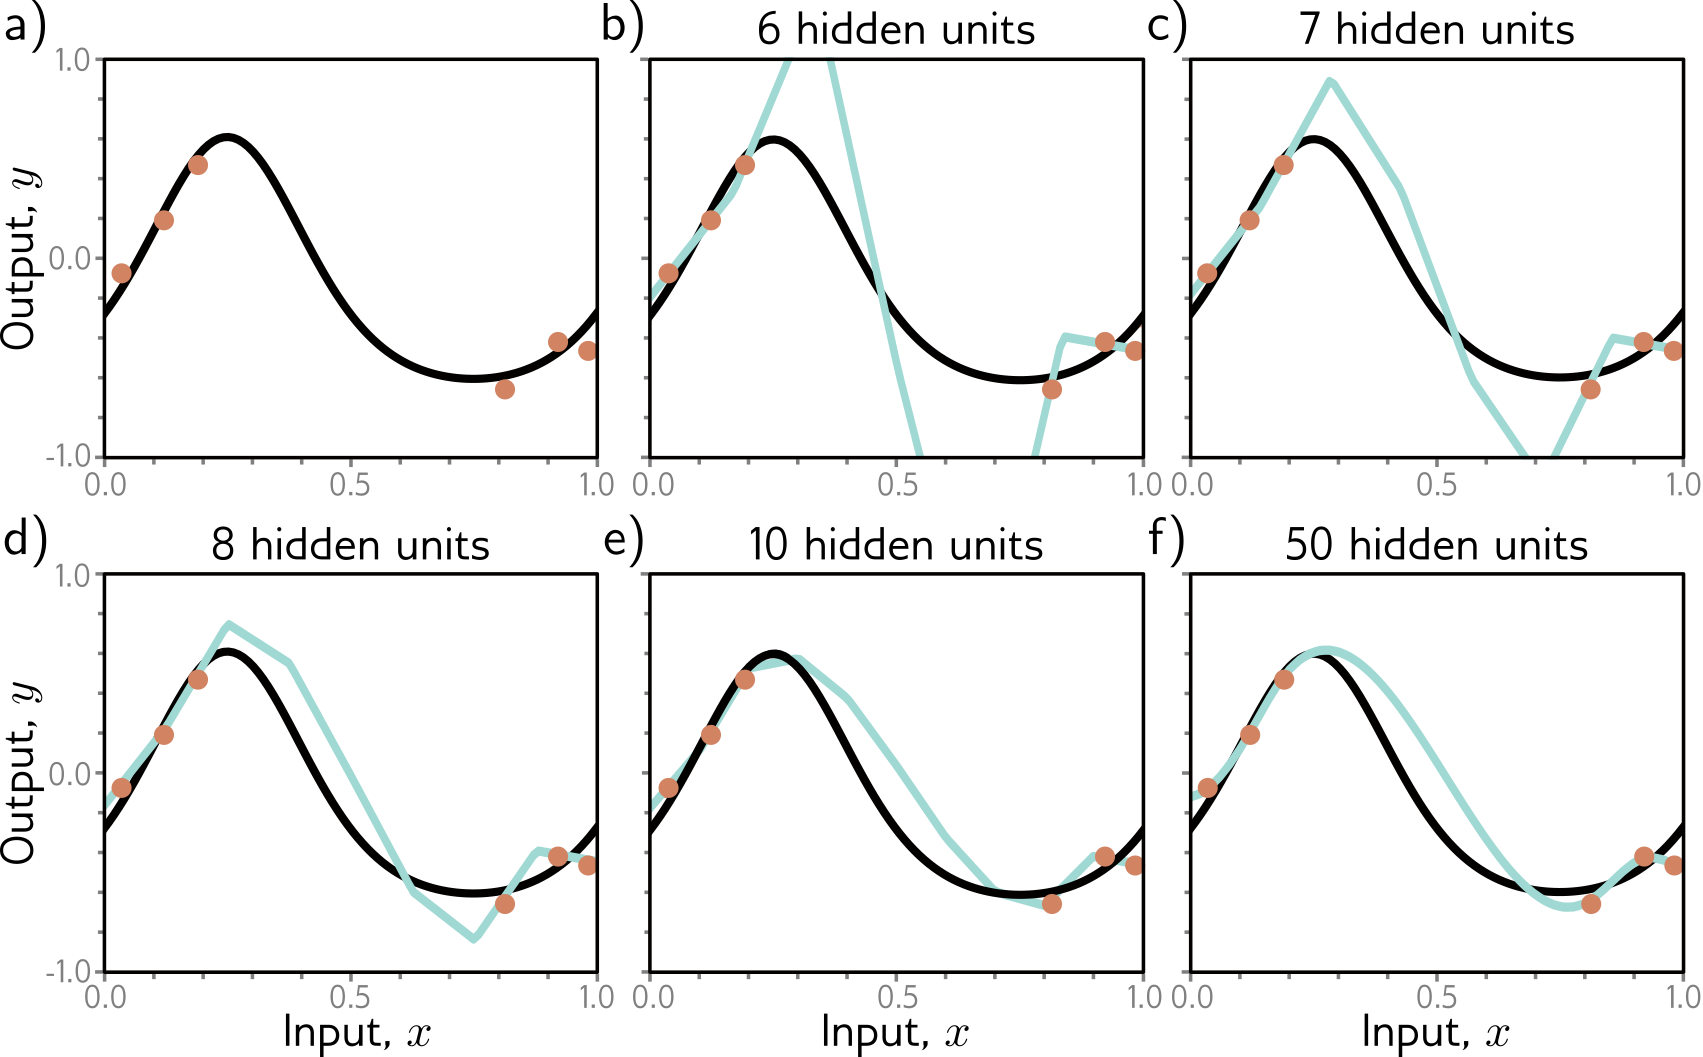
Smoothness
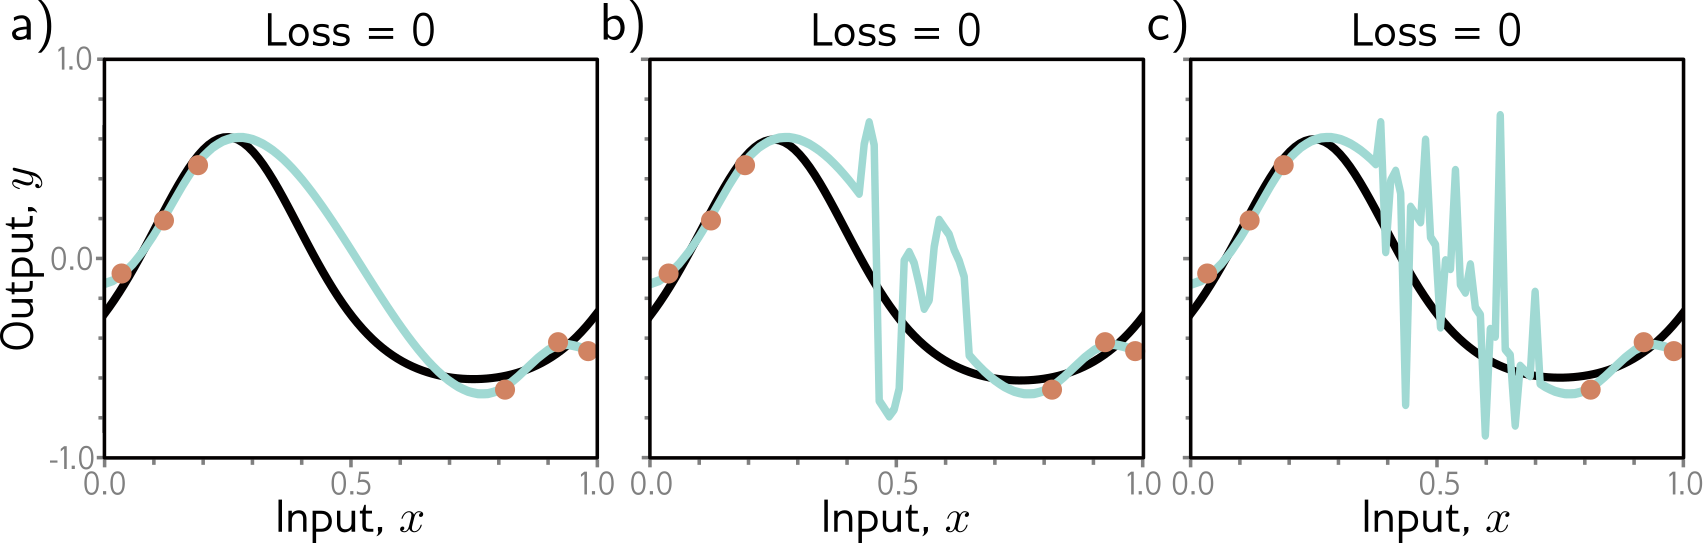
All of these have equivalent training-set loss. Which should we choose?
How to achieve smoothness?
Dropout
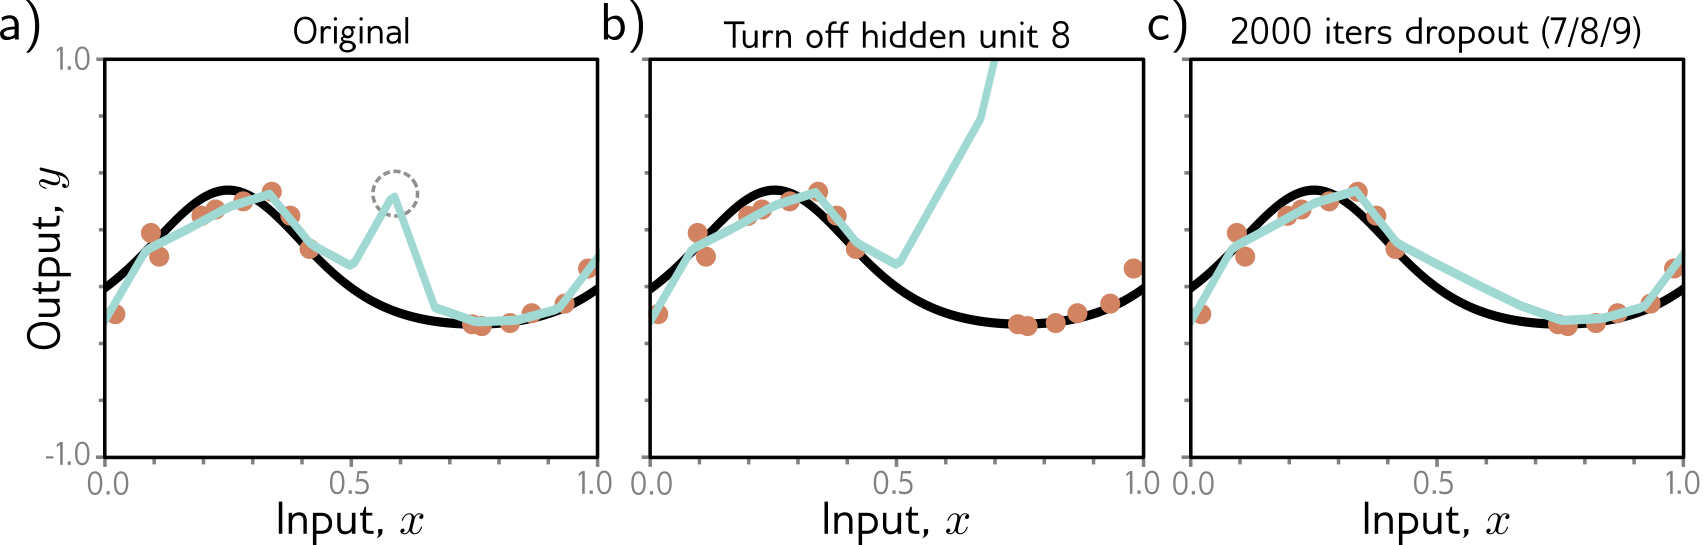
- Randomly zero out some activations.
- Model can’t over-rely on one single feature.
Data Augmentation

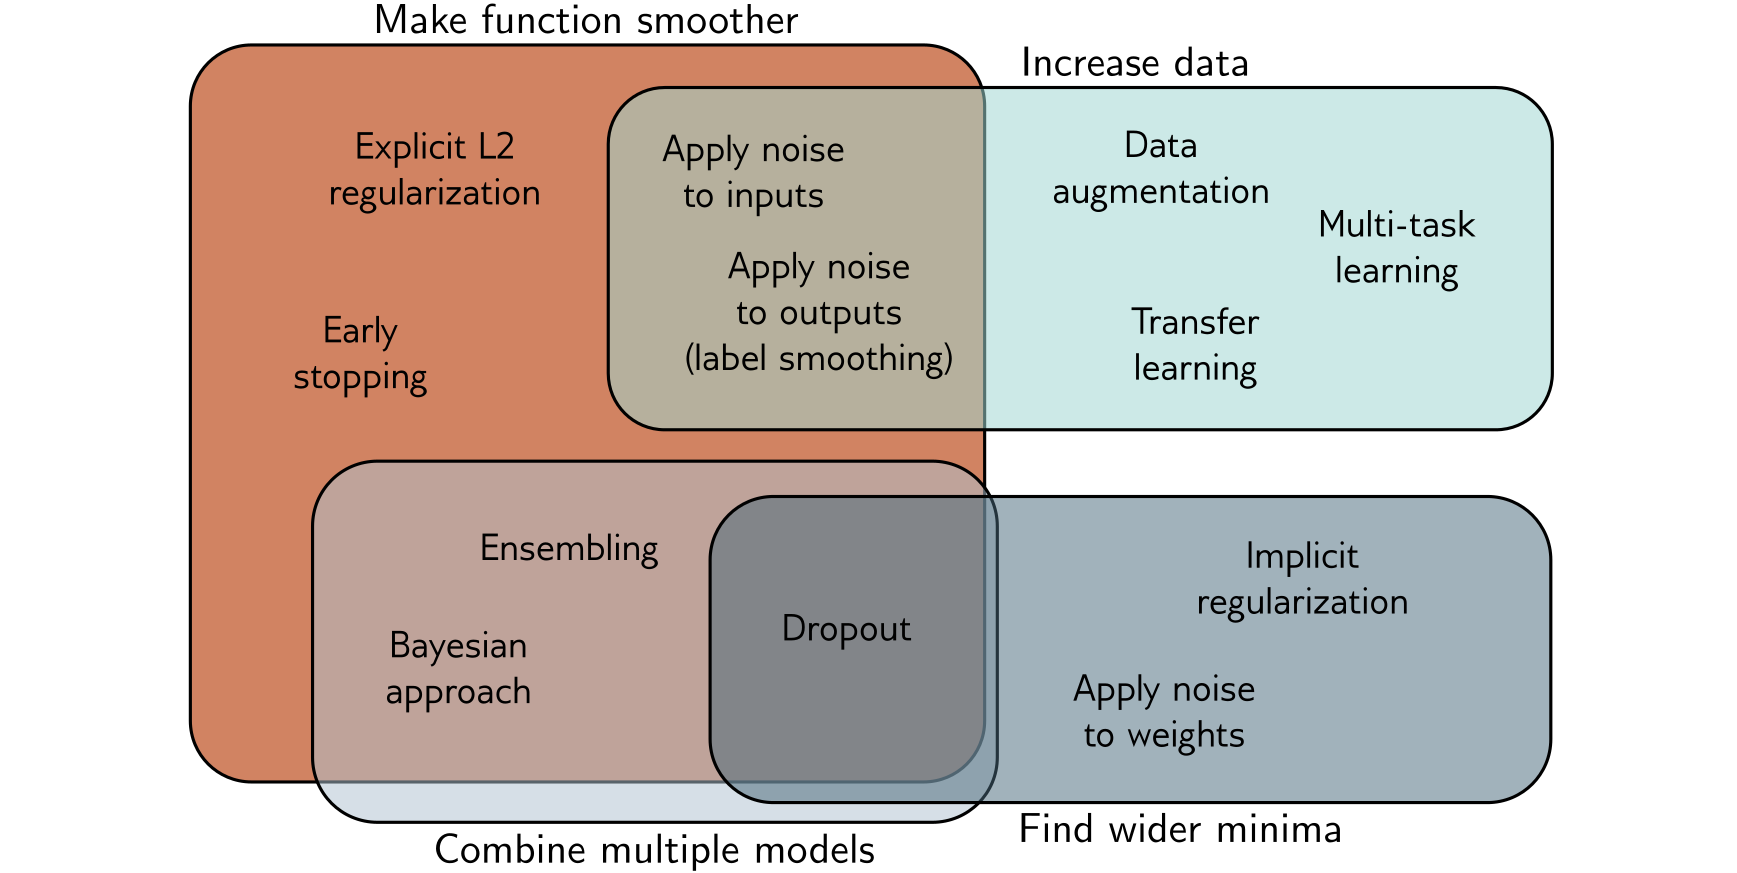
Summary of Methods
Weight Decay
Which would need larger weights?
- One neuron activates for each training example
- Several different neurons activate for each training example
Weight decay encourages #2
Label Smoothing Penalizes Overconfidence
Regularization inside a model
- Weight decay (penalize large weights)
- Dropout (randomly zero out activations)
Supplemental Material on Recommender Systems
Objectives
- What data do recommender systems work with?
- What outputs do recommender systems produce?
- What are the core ideas behind the collaborative filtering approach to recommender systems?
- Identify what embeddings are.
- Describe how embeddings address the problem of high cardinality.
- Compare and contrast item embeddings (in recommender systems) and word embeddings (in language modeling).
Recommender Systems
Think of a few experiences you’ve had with recommender systems.
- What sort of things were recommended to you?
- What were some signals that you gave to the system that the recommendation was good (or not)?
- What other data did the system have about you?
- What other data did the system have about the items it recommended to you?
Latent Vectors: Genres
- Imagine you know the “genre” of each video.
- “Will user X like video Y?” = how many of the movie’s genres does the user like?
(In practice we don’t actually know all of the “genre” features. Soon we’ll see how we can learn them.)
Which movies are similar?
Intuition: represent a movie by its genre vector.
| title | Star Wars (1977) | Contact (1997) | Fargo (1996) | Return of the Jedi (1983) | Liar Liar (1997) | English Patient, The (1996) | Scream (1996) | Toy Story (1995) | Air Force One (1997) | Independence Day (ID4) (1996) |
|---|---|---|---|---|---|---|---|---|---|---|
| Action | 1 | 0 | 0 | 1 | 0 | 0 | 0 | 0 | 1 | 1 |
| Adventure | 1 | 0 | 0 | 1 | 0 | 0 | 0 | 0 | 0 | 0 |
| Animation | 0 | 0 | 0 | 0 | 0 | 0 | 0 | 1 | 0 | 0 |
| Children’s | 0 | 0 | 0 | 0 | 0 | 0 | 0 | 1 | 0 | 0 |
| Comedy | 0 | 0 | 0 | 0 | 1 | 0 | 0 | 1 | 0 | 0 |
| Crime | 0 | 0 | 1 | 0 | 0 | 0 | 0 | 0 | 0 | 0 |
| Documentary | 0 | 0 | 0 | 0 | 0 | 0 | 0 | 0 | 0 | 0 |
| Drama | 0 | 1 | 1 | 0 | 0 | 1 | 0 | 0 | 0 | 0 |
| Fantasy | 0 | 0 | 0 | 0 | 0 | 0 | 0 | 0 | 0 | 0 |
| Film-Noir | 0 | 0 | 0 | 0 | 0 | 0 | 0 | 0 | 0 | 0 |
| Horror | 0 | 0 | 0 | 0 | 0 | 0 | 1 | 0 | 0 | 0 |
| Musical | 0 | 0 | 0 | 0 | 0 | 0 | 0 | 0 | 0 | 0 |
| Mystery | 0 | 0 | 0 | 0 | 0 | 0 | 0 | 0 | 0 | 0 |
| Romance | 1 | 0 | 0 | 1 | 0 | 1 | 0 | 0 | 0 | 0 |
| Sci-Fi | 1 | 1 | 0 | 1 | 0 | 0 | 0 | 0 | 0 | 1 |
| Thriller | 0 | 0 | 1 | 0 | 0 | 0 | 1 | 0 | 1 | 0 |
| War | 1 | 0 | 0 | 1 | 0 | 1 | 0 | 0 | 0 | 1 |
| Western | 0 | 0 | 0 | 0 | 0 | 0 | 0 | 0 | 0 | 0 |
Genre vectors are embeddings (but not great ones)
- A vector for each thing
- Typically tens or hundreds of numbers
- fewer numbers than the number of things (so can’t be one-hot)
- a “bottleneck”: has to represent everything important about the thing
- Typically trained so that similarity is meaningful.
How do embeddings measure similarity?
- Two movies are similar if their genre vectors are “nearby”.
- e.g., “Star Wars (A New Hope)” and “Return of the Jedi” share 5 genres with each other
- … 3 with “Independence Day”
- … and 0 with “Toy Story”
Can you think of a math operation that would give us the number of genres in common? Perhaps from linear algebra?
- Multiply pairs of numbers. (Each genre shared by two movies gets a 1; otherwise 0.) Then sum.
- aka, the dot product.
- sometimes normalize by vector magnitude (giving “cosine similarity”)
User Vectors
- We can represent each user by a vector too
- Simple model: rating = dot product of user vector and movie vector
- Intuition: how much does that user like each genre?
- e.g., “I like action movies, but not horror movies”
- More complex models are possible too.
What would your user vector look like?
Learn User Vectors by Gradient Descent
- Imagine you know the “genre” of each video.
- Use data to determine which genres each user likes.
How might we do that?
Learn Everything by Gradient Descent
- Suppose some videos lack genre information. We could look at which users liked them.
- But then we’d get better vectors for those users.
- So we could use those to get better vectors for even the movies that we do have genre data for.
- Turns out we don’t need any prior genre information; just initialize randomly and learn from data.
Algorithm to Learn Embeddings from Data
Same as usual:
- Construct a model with vectors for each user and each movie
- Initialize randomly
- For each batch of ratings:
- Compute the predictions
- Compute the loss
- Compute the gradients
- Update the parameters
How do embeddings solve high cardinality?
Work with tens of numbers instead of tens of thousands of movies.